How much should you plan to spend each year in retirement? That depends in large part on your budget. How much will it cost to satisfy basic needs and what other sorts of discretionary expenses do you have in mind? It also depends on the resources you have available, such as your financial assets, Social Security and other pensions, and other possibilities such as part-time work. For assets which do not provide guaranteed lifetime incomes, there is a tradeoff at work that spending more now risks the possibility for having to cut back on spending later in life. We may need to sacrifice some of the more discretionary types of expenses now in order to save enough to meet basic needs when financial markets are not cooperating. How do we balance this tradeoff?
The answer provided by economists is that we should seek to maximize our overall lifetime satisfaction subject to the constraints we face in terms of our available resources. To know how to maximize this satisfaction, we need to think not simply in terms of spending amounts, but rather how much value is provided by that spending. Economists call this ‘utility maximization.’ Lots of people will have horrible flashbacks to their principles of economics class and shudder at the thought of this term. They will want to avoid discussing it. They will say that to know how to maximize utility, we need to know the shape of the utility function and the appropriate ‘risk aversion coefficient.’ They will say that this is essentially impossible. They will say it is nonsense dreamed up by ivory tower types.While there some truth to all of that, the reality is that it is impossible to avoid utility maximization.
It is just that with other analytical tools, we may end up maximizing a utility function which doesn’t make much sense. Utility is really about assigning a value for the enjoyment providing by your spending, and even if you think you are avoiding utility, you really are not.Consider the traditional failure rate measure for safe withdrawal rate studies. It is the probability that financial assets are depleted during one’s lifetime or during a specified time period such as 30 years. The idea of safe withdrawal rate studies is to choose a spending strategy that keeps the probability of failure at a sufficiently low level. Whether you like it or not, this is a utility function. It defines the value of additional spending as basically zero.
There is no benefit from spending more, it can only hurt. Importance is only placed on the outcomes where wealth is depleted. And so, spending is pushed downward to avoid this. It is a utility function which only focuses on downside risks and not on any of the positives of spending more.What is a measure that considers both downside risk and upside positives? A simple one could be either total lifetime spending or average lifetime spending. Now there is benefit from spending more… it helps to push up the average. At the same time though, the tradeoff between spending more now and spending less later also appears, because later spending reductions would reduce the total and average. You increase spending if it provides a net gain after accounting for this.
You may think ‘average lifetime spending’ is not a utility function, but it is. And it is a rather odd one, because it assumes that the value of additional spending is the same no matter how much you spend. The enjoyment you get from eating the 1st slice of pizza matches the enjoyment you get from eating the 10th slice of pizza. This seems to fly in the face of human experience.The reason that the economist’s conception of utility maximization seems frightening is that it says the value of additional spending is not simply linear in this way, but it rather has a curved shape. Curves must be defined with more complicated mathematical equations than lines. With the curve, more spending is better than less, but the additional value provided by more and more spending diminishes as spending increases. The highest priority expenses provide great value since they fulfill essential human needs such as food and shelter. But as expenses increase higher and higher, well there are just so many nights you can spend in 5-star hotels before starting to get fed up with the experience.
The additional life-improving value provided by spending will surely be less as spending grows.I illustrate this idea in the following figure. It shows the value of spending for two different utility functions. The curved utility function (for the technically inclined, it is the logarithm of spending) shows the properties that spending more always provides greater value, but the increases in value are diminishing as spending increases. Looking toward spending reductions, the impact of such reductions grows dramatically larger as spending falls lower and lower.
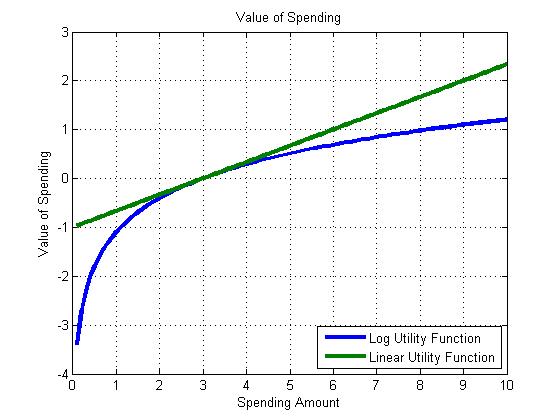
We can quibble about what the exact shape of this curve should be to properly define the value of spending. In this case, the increased value in moving from 0.1 to 1 matches the increased value in moving from 1 to 10. Is that realistic? Well, it is probably hard to say even for someone carefully studying their budget and trying to assign value to different expenses.But this brings us back to my earlier point. It is impossible to avoid using a utility function. In a lot of cases, the value assigned to spending implicit in the outcome measure may not really make much sense when you think about it.
Though the blue curve in my figure may not be a precise match for anyone’s utility, I think it comes a lot closer to being correct than the green line (implied by average spending) or than a measure like failure rates which only looks at downside and ignores upside. I’d be happy with just using the relatively simple blue curve in that figure. I think it gets us a lot closer to something realistic. We add up the values provided by each year’s spending amount over the lifetime. If we wish, multiplying later spending amounts by the probability of surviving to that age is also a possibility that will give more importance to what happens in the early part of retirement.
But this is optional and depends on your own personal preferences. What are the implications of defining the value of spending in this way? It does put importance both on downside risk and on the value of more spending. It provides a way to determine the proper balance. Spending more is nice and it provides more value. At the same time, that increase in value may not be enough to counteract the potential reduced spending that may have to happen later on.
Another implication is that consumption smoothing (spending the same amount each year) is optimal, which is why economists tend to like real fixed income annuities (SPIAs). Without annuities, it is hard to achieve smooth consumption when spending down from a portfolio of volatile assets. Variable withdrawal strategies which respond to market performance tend to outperform the traditional ‘constant inflation-adjusted withdrawal amount until wealth is gone’ strategy. But something called ‘habit formation’ can also be introduced to the utility function which penalizes reductions to spending on account that people don’t like reducing their standard of living. This will help smooth spending patterns.
And so with this tool we have a more realistic way to compare retirement income strategies that provide the best balance of spending over the lifetime.
To find out more about investing in retirement, read our eBook 8 Tips to Becoming a Retirement Income Investor.


