Your asset allocation defines your portfolio. What you own and how you build your portfolio determines what your returns will look like through time.
But all too often, the funds you use end up sabotaging your asset allocation.
When you build your investment portfolio, you select specific investment vehicles to fill specific roles. If you want exposure to US small cap stocks, then you’ll include a fund that owns US small cap stocks (or buy some directly, though this is usually a bad idea) in your asset allocation.
If you want exposure to short-term US Treasury bonds, then you’ll include a fund that owns short-term US Treasury bonds (or buy some directly – this is a much more reasonable idea) in your asset allocation.
But what if the funds you select don’t do what you think they will?
When you use actively managed funds, you have to watch out for something called “style drift” – when a fund’s style (what the fund actually owns) moves over time.
For anyone who takes the time to build an asset allocation tailored to their specific risk tolerance, this is a massive problem. The fund manager you hired has hijacked the level of risk in your portfolio.
This would be one thing if the manager was able to predict what the market was going to do next. But the data is pretty clear that this just doesn’t happen. Active managers are only able to beat the market by pure luck, and it doesn’t last.
So not only are you paying extra to add randomness into your portfolio, in many cases the active manager is actively mucking up you’re comfortable level of risk.
To put it mildly, this is not a good thing.
So how do you avoid it?
Monitoring Style Drift
The easiest way to avoid style drift is to use an index fund or other passive fund. They are going to stay right where you expect them to be. Their manager isn’t going to be jerking the fund around based on their hunches about what the market will do next. You’ll get disciplined exposure to risk factors you want.
If you really want to use active funds, then you’ll need to look at how much a fund has drifted in the past, and also continuously monitor it going forward.
Assessing Historical Style Drift
An active fund’s historical style drift is a decent indicator of just how much a fund might drift in the future (especially when you look at the current fund manager’s tenure). If they have been all over the place in the past, they’ll probably be all over the place in the future. If they’ve stayed reasonably consistent in the past, then there’s a chance they will stay consistent in the future.
There are all sorts of ways to look at style drift, but the best way is to use regression analysis to see exactly how much and what kinds of risk a fund took through time. By looking at the fund’s historical returns, we can look at exactly what the fund did. We can see how the fund positioned itself against the investment risk factors through time – and how that has changed.
In this analysis, we’ll look at two funds – Fidelity’s Magellan Fund (FMAGX) and Vanguard’s Explorer Fund (VEXPX) – and how they’ve drifted through time against the equity size and value risk premiums.
I chose these funds semi-randomly (I was on the Vanguard website for something else when I decided to write this article, and the Magellan fund is one of the classic examples of style drift – and they both have really long histories), but I could have chosen pretty much any actively managed fund and we would probably see some degree of style drift.
As long as an active fund isn’t a closet indexer it’s going to move around as the manager repositions the fund to take advantage of “opportunities.”
Now that we’ve set the stage, what does the data tell us?
The Baseline
I always like to start by looking at all of the data available. It gives us a good foundation and a nice sense of the total picture before we start pulling everything apart.
In this case, both funds have been around basically forever (Magellan was started in 1963, Explorer in 1968). In fact, they go so far back that we’re limited by the data history on some of our comparative indices rather than the funds.
We’re starting at the beginning of 1979 with the inception of the Russell indices. To make it easier to pick them out, I’ve made the markers for the Magellan and Explorer funds ornage.
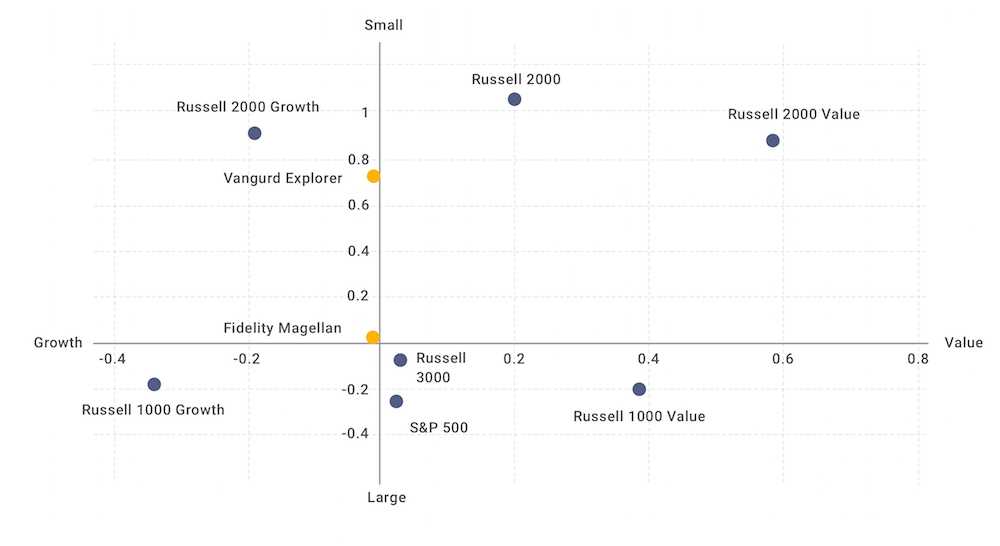
As you can see, over the entire time period (1/79 – 5/23), the Magellan fund basically looked like the market. And the Explorer fund was a small cap fund with basically no value/growth tilt.
But what if we start breaking up the period?
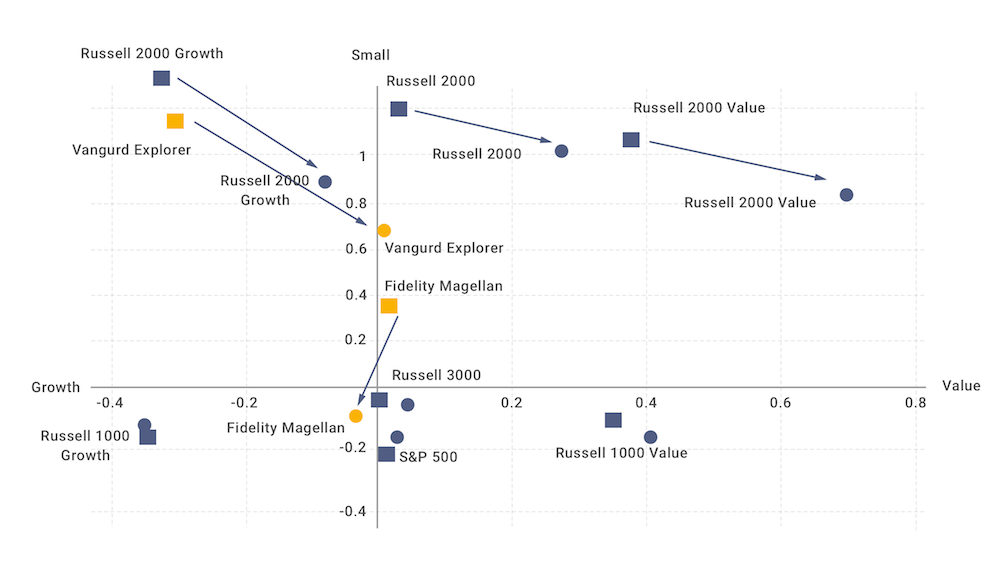
To keep things simple, let’s just break it in half (the results are more dramatic the finer you go, but the charts get messy). So now we have two time periods we’re looking at – the first period from 1/79 through 3/01, and the second period from 4/01 through 5/23.
A couple things to pay attention to here:
- Everything moved. Indices have specific rules for how they are constructed, and depending on the time period will capture slightly different relative sections of the market – especially if you look at the Russell small cap indices (though a lot of the shift along the value premium is from applying their value/growth screen back into the past since they backfilled data to get a longer returns series.[1]
But
- There’s a pretty significant difference between the indices and at the Magellan Fund. These are not changes based on how the rules happened to hit. These are changes based on what the fund manager thought was going to get them better results. They either wanted higher returns or lower volatility. In other words, they were intentionally changing the level of risk in their portfolio – and in turn changing the level of risk you were taking in your portfolio.
- On the other hand, the Explorer fund didn’t move all that much, overall (though if you use different time periods you get an almost as dramatic movement as you see with the Magellan Fund). It’s always going to come down to the specifics of the fund. How tightly defined are the fund parameters? How well does the fund manager stick to those parameters? And, importantly, will those funds that are disciplined stay so through time?
One of the other things this draws out is that style drift can also come about from a fund getting too big. The Magellan Fund was the biggest fund in the world during it’s heyday. They basically had people throwing their money at them – especially toward the end of Peter Lynch’s tenure.
When a fund gets too big, it is harder for it to stay on the peripheries of the market. It just can’t put all of its money to use as easily as it could when the fund was smaller. So the powers that be start repositioning the fund to look more and more market-like.
The Magellan fund went from a mid-cap fund to almost a pure market fund. This makes sense – at its biggest, the Magellan fund was massive. To put all of its money to work, it either had to drive up the prices of stocks it wanted to own (in turn making them “less attractive”) or take small positions in a whole bunch of stocks.
When you start putting small amounts in a lot of different stocks, eventually you end up with the entire market.
We can see this if we do one more slice on just the Magellan fund.
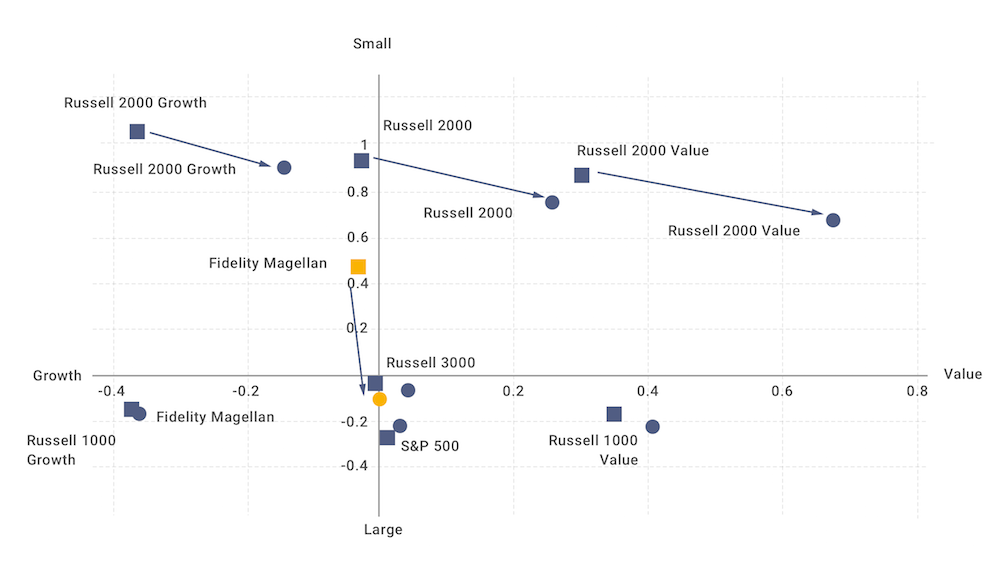
The first period is under Peter Lynch (1/79-5/90 – he actually started in ’77 but we’re still limited by the Russell indices), and the second period is everything since then (6/90 – 5/23). We see that shift from a mid-cap fund to a market fund even more clearly.
Whatever the cause of style drift, it changes the level of risk in your portfolio without your consent. When you hire a small cap manager, you need to be confident that they will stay a small cap manager. And that’s something that very few active managers can promise.
Going Forward
Everything we’ve done up until now is historical. We can look at the numbers every which way, and we can figure out every little nuance of what a fund has done in the past, but that doesn’t help you much when you want to know if one of your funds is drifting now.
While you can use regression analysis to get a sense of it, it’s not the best tool since it requires reasonably long time periods to get reliable results – it can tell you if the fund looked different over the last three or four years compared to the prior three or four years, but that’s not always that useful (plus, the answer is probably yes).
What you want is something you can monitor on an ongoing basis that will give you a sense of when the fund is starting to drift. The easiest way to do that is to monitor the ratio of the fund’s average market cap and price/book (or any other measurement of value) versus a comparable index (the easiest is probably going to be their chosen benchmark – but not always). If the fund starts looking different than it looked relative to its benchmark in the past, you know it’s starting to drift.
Using the Magellan fund again, let’s see what this looks like:
| Magellan Fund | Russell 1000 Growth Index | Ratio | |
| Average Market Cap | $111,433 | $388,636 | 0.29 |
| Price/Book | 6.79 | 10.8 | 0.63 |

If we start seeing those ratios drift significantly, that means the fund is moving relative to its category – in other words, we’re seeing style drift.
Style drift is a fact of life if you’re using actively managed funds. But that doesn’t mean it’s a good thing.
Style drift means you are giving control of your asset allocation to someone who has no clue who you are. They’re focused on getting the best returns they can for their fund (we’ll leave aside the question of whether they can actually do that or not…). They aren’t focused on making sure their fund fits into your retirement plan.
And that’s the key.
We’re not just investing to get the highest return possible. If we were, we would just put everything into small value and let it rip. No – we’re looking to build a portfolio that will help you reach your retirement objectives.
And we do this by very tightly targeting the level of risk in your portfolio. And we can’t accurately target the level of risk in your portfolio if the funds you use are bouncing all over the place.
To find out more about how to build an investment portfolio that works for you, read our eBook 9 Principles of Intelligent Investors.
[1] For an actual trading vehicle (like a fund) this would be a massively bad thing, but because the index has deterministic rules it can work. You just need to be aware of what’s happening.
* I previously worked at Dimensional Fund Advisors, and my father is currently on the Board of Directors of Dimensional Fund Advisors.


