One other important factor from William Bengen’s original study is asset allocation. In particular, he recommended that retirees maintain a stock allocation of 50-75%, writing, “I think it is appropriate to advise the client to accept a stock allocation as close to 75 percent as possible, and in no cases less than 50 percent.”
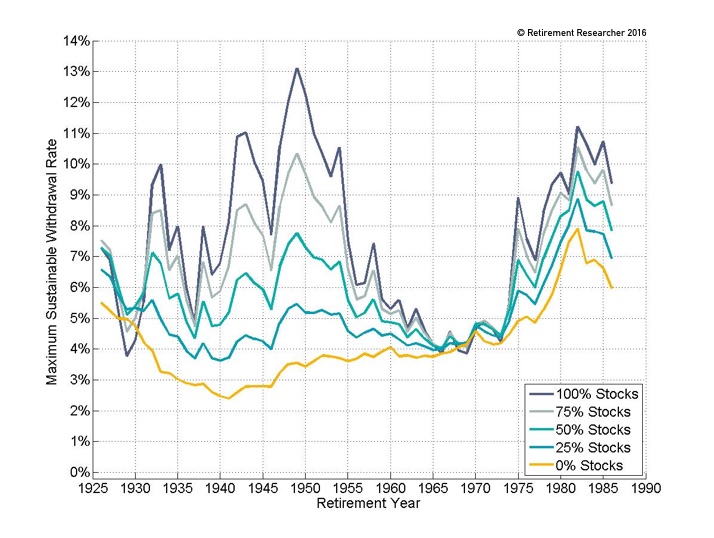
Exhibit 1 provides an illustration of how Bengen reached this conclusion by showing the time path of maximum sustainable withdrawal rates for different asset allocations. It is hard to see exactly what is going on in the 1960s, but the general idea is that higher stock allocations tended to support higher withdrawal rates, with little in the way of downside risk. The SAFEMAX does not appear to be that much lower with higher stock allocations, though the potential for upside with higher stock allocations is quite striking as higher sustainable withdrawal rates are possible with all but the worst-case outcomes.
Exhibit 1
Maximum Sustainable Withdrawal Rates
For Various Asset Allocations, 30-Year Retirement, Inflation Adjustments
Using SBBI Data, 1926-2015, S&P 500 and Intermediate-Term Government Bonds
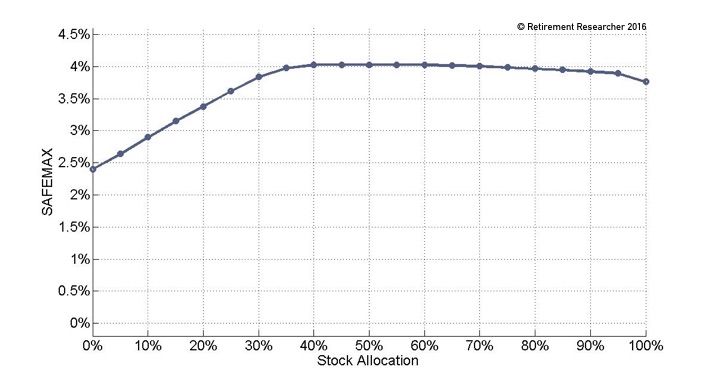
This point can be seen more clearly in Exhibit 2, which shows the SAFEMAX across the range of stock allocations. Low stock allocations resulted in lower SAFEMAXs, with an all-bonds portfolio falling below 2.5%. But there is a sweet spot between about 35% stocks and 80% stocks where higher stock allocations have no discernable impact on the SAFEMAX. A 4% withdrawal rate tended to work no matter what stock allocation was chosen in this range. On the downside, retirees would have been just as well-off with 80% stocks as with 35% stocks.
Underlying Philosophy and Assumptions of the 4% Rule
- The objective is to meet an overall lifestyle spending goal. Retirees are assumed to desire smooth spending, but also have an appetite for market volatility.
- Withdrawals are defined as a percentage of the retirement date portfolio balance. In subsequent years, withdrawal amounts are adjusted for the previous year’s rate of inflation (or deflation). Retirees do not voluntarily reduce spending as they age or adjust withdrawals in response to realized financial market returns. Withdrawals are constant, inflation-adjusted amounts.
- Failure is defined as not meeting the overall spending goal for the full assumed retirement time horizon. The underlying objective is to keep the failure rate (the probability of portfolio depletion) at a reasonably low level.
- Risk Management:
- Market Risks: Use a diversified portfolio focused on total returns with spending from income and principal. Historically, 50-75% stocks maximizes the probability of plan success.
- Longevity Risks: Assume a planning horizon sufficiently beyond life expectancy. The 4% rule is calibrated specifically to a 30-year horizon.
- Spending Risks: Precautionary savings. As the 4% rule is calibrated to be sustainable in the worst case from history, it otherwise preserves assets that could potentially be deployed for contingencies in other cases.
- Retirees earn the precise underlying investment returns net of any fees for a fixed asset allocation with annual portfolio rebalancing. Withdrawals are taken at the start of the year. The investment portfolio is either tax-deferred or tax free. The two financial assets are large-capitalization stocks (S&P 500) and intermediate-term U.S. government bonds.
- With historical simulations, hypothetical retirements begin at the start of each year in the historical record for which sufficient data remains to calculate the sustainable withdrawal rate for the specified retirement duration. A series of hypothetical asset returns which behave according to the underlying assumptions—called “Monte Carlo simulations”—is created for each simulation.
- The US historical experience is sufficiently representative of what future retirees may expect for their own retirements.
Exhibit 2
Connection Between SAFEMAX and Stock Allocation
30-Year Retirement, Inflation Adjustments
Using SBBI Data, 1926-2015, S&P 500 and Intermediate-Term Government Bonds
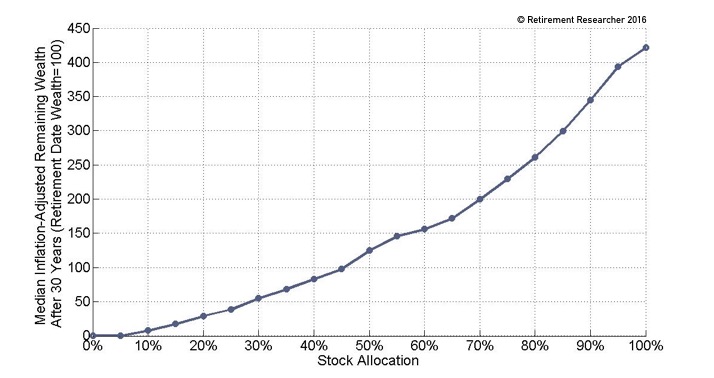
Why, then, did William Bengen recommend 50-75% stocks? The answer lies in Exhibit 3, which shows the median remaining inflation-adjusted real wealth after thirty years as a multiple of retirement date wealth when using a 4% withdrawal rate. In this figure, we can see a general upward trajectory in remaining wealth as the stock allocation increases. In the average case, retirees using at least 45% stocks would have found that the real inflation-adjusted value of their portfolio remained after thirty years. And with higher stock allocations, wealth tended to continue to grow in the median outcome. So while Exhibit 2 shows little in the way of downside spending risk with higher stock allocations, Exhibit 3 shows that there is plenty of upside potential available with higher stock allocations. This is the justification for Bengen’s recommendation.
Exhibit 3
Connection Between Median Remaining Real Wealth After 30 Years and Stock Allocation
For a 4% Withdrawal Rate, Inflation Adjustments
Using SBBI Data, 1926-2015, S&P 500 and Intermediate Term Government Bonds
To find out more about investing in retirement, read our eBook 8 Tips to Becoming a Retirement Income Investor.


