One of the classic approaches to studying retirement withdrawal rates is to use Monte Carlo simulations that are parameterized to the same historical data as used in historical simulations. This can be done either by randomly drawing past returns from the historical data to construct thirty-year sequences of returns (a process known as “bootstrapping”), or by simulating returns from a statistical distribution (usually a multivariate normal or lognormal distribution) that matches the historical parameters for asset returns, standard deviations, and correlations.
Simply put, Monte Carlo simulations provide a well where you can develop sequences of random market returns fitting predetermined characteristics, in order to test how financial plans will perform in a wider variety of good and bad market environments.
Financial planner Lynn Hopewell implored the financial advisory profession to adopt Monte Carlo simulation tools in his seminal 1997 article in the Journal of Financial Planning, “Decision Making Under Conditions of Uncertainty: A Wakeup Call for the Financial Planning Profession.“ He argued forcefully against merely developing spreadsheets for financial plans based on average input assumptions, or by testing the robustness of plans with worst-case scenarios. He said those approaches do not provide probabilities for outcomes, and it is still difficult to know how to develop a financial plan, save, and spend using such limited analysis.
Today, Monte Carlo analysis is at the heart of most financial planning software programs that aim to test the feasibility of financial plans.
Monte Carlo simulations have a number of advantages over their historical simulations counterparts based on the analysis in Bengen’s work and the Trinity Study. First, Monte Carlo allows for a wider variety of scenarios than the rather limited historical data can provide. Between 1926 and 2015, there are only sixty-one rolling thirty-year periods, and these are not independent periods since they share so many overlapping data points.
Meanwhile, it is not uncommon to see a Monte Carlo simulation study based on 10,000 or more simulated paths for financial market returns. This provides an opportunity to observe a wider variety of return sequences that support a deeper perspective about possible retirement outcomes.
Because of the way overlapping periods are formed with historical simulations, the middle part of the historical record plays a disproportionately important role in the analysis. With data since 1926 and for thirty-year retirement durations, 1926 appears in one rolling historical simulation, while 1927 appears in two (for the 1926 and 1927 retirees). This pattern continues until 1955, which appears in thirty simulations (the last year for the 1926 retiree through the first year for the 1955 retiree).
The years 1955 through 1986 all appear in thirty simulated retirements, with 1987 appearring in twenty-nine simulations, through 2015, which only appears in one simulation (as the final year of retirement for the 1986 retiree). This overweighted portion of the data (1955-1986) coincides with a bear market for bonds. During this time, the real arithmetic return on intermediate-term government bonds was 2%, compared to an average of 2.6% for the combined years prior to 1955 and after 1986.
The differences are even more severe for long-term government and corporate bonds. For instance, with long-term government bonds, the real arithmetic return between 1955 and 1986 was 1%, compared to 4.3% for the years before and after this period.
In contrast, Monte Carlo simulations treat each data point as equally important. This has implications for portfolio success rates with different asset allocations. Essentially, bonds will have more opportunity to shine with Monte Carlo.
In addition, with many more simulations we can expect some scenarios where a particular spending strategy will not work even when it always worked in the same historical data that drives the simulations. Monte Carlo simulations of the 4% rule based on the same underlying data as historical simulations tend to show greater relative success for bond-heavy strategies, less relative success for stock-heavy strategies, and lower optimal stock allocations.
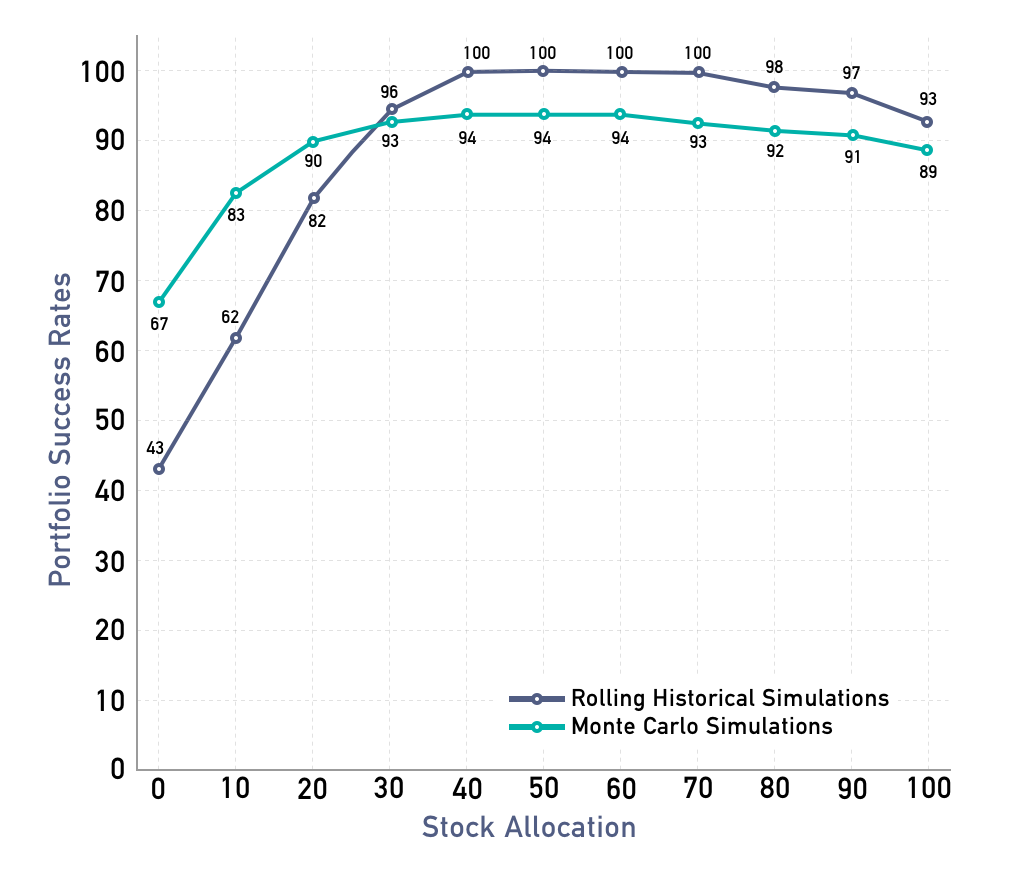
Exhibit 1 compares the portfolio success rates for varying asset allocations when using a 4% withdrawal rate over thirty-year periods. Four-percent withdrawals did not fail in the historical period for stock allocations between 40 and 70%. Bond-heavy portfolios experienced much lower success rates, though, with a bonds-only portfolio providing success in 42% of the historical simulations.
Exhibit 1
Portfolio Success Rates for a 4% Withdrawal Rate
30-Year Retirement, Inflation Adjustments
Using SBBI Data, 1926-2015, S&P 500 and Intermediate Term Government Bonds
A downside for Monte Carlo simulations is that they do not reflect other characteristics of the historical data not incorporated into the assumptions. For instance, most Monte Carlo simulations used by financial planners do not incorporate mean reversion guided by market valuations, though the U.S. historical record has generally exhibited such behavior.
Also, Monte Carlo simulations that do not include “fat tails” in the distribution of returns may not create extreme low or high returns as frequently as seen in reality. However, these two factors may partly offset one another. The lack of mean reversion makes it more likely that extreme returns will happen repeatedly, creating the same overall effect as more extreme one-time returns.
This relates to the next point, which is that the results of Monte Carlo simulations are only as good as the input assumptions, though when thinking about future retirements, historical simulations are likely to be even more disadvantaged by this issue. Monte Carlo simulations can be easily adjusted to account for changing realities for financial markets.
Overall, the advantages of Monte Carlo simulations likely more than make up for any deficiencies when compared to the results we obtain using historical simulations.