Dashboard
For a Benchmark Couple Both Turning 65 in January 2023
Individuals who save in a very responsible way can end up experiencing very different retirement outcomes on account of the market returns they experienced during the specific years of work and retirement. Through no fault of their own, some people will be saving at a good time (strong market returns in the years just before and after their retirement, which impacts wealth accumulations and sustainable spending rates), while others will not be so lucky.
Is now a good time to retire? My Retirement Dashboard aims to help answer this question by tracking the situation of a hypothetical benchmark retiree couple reaching age 65.
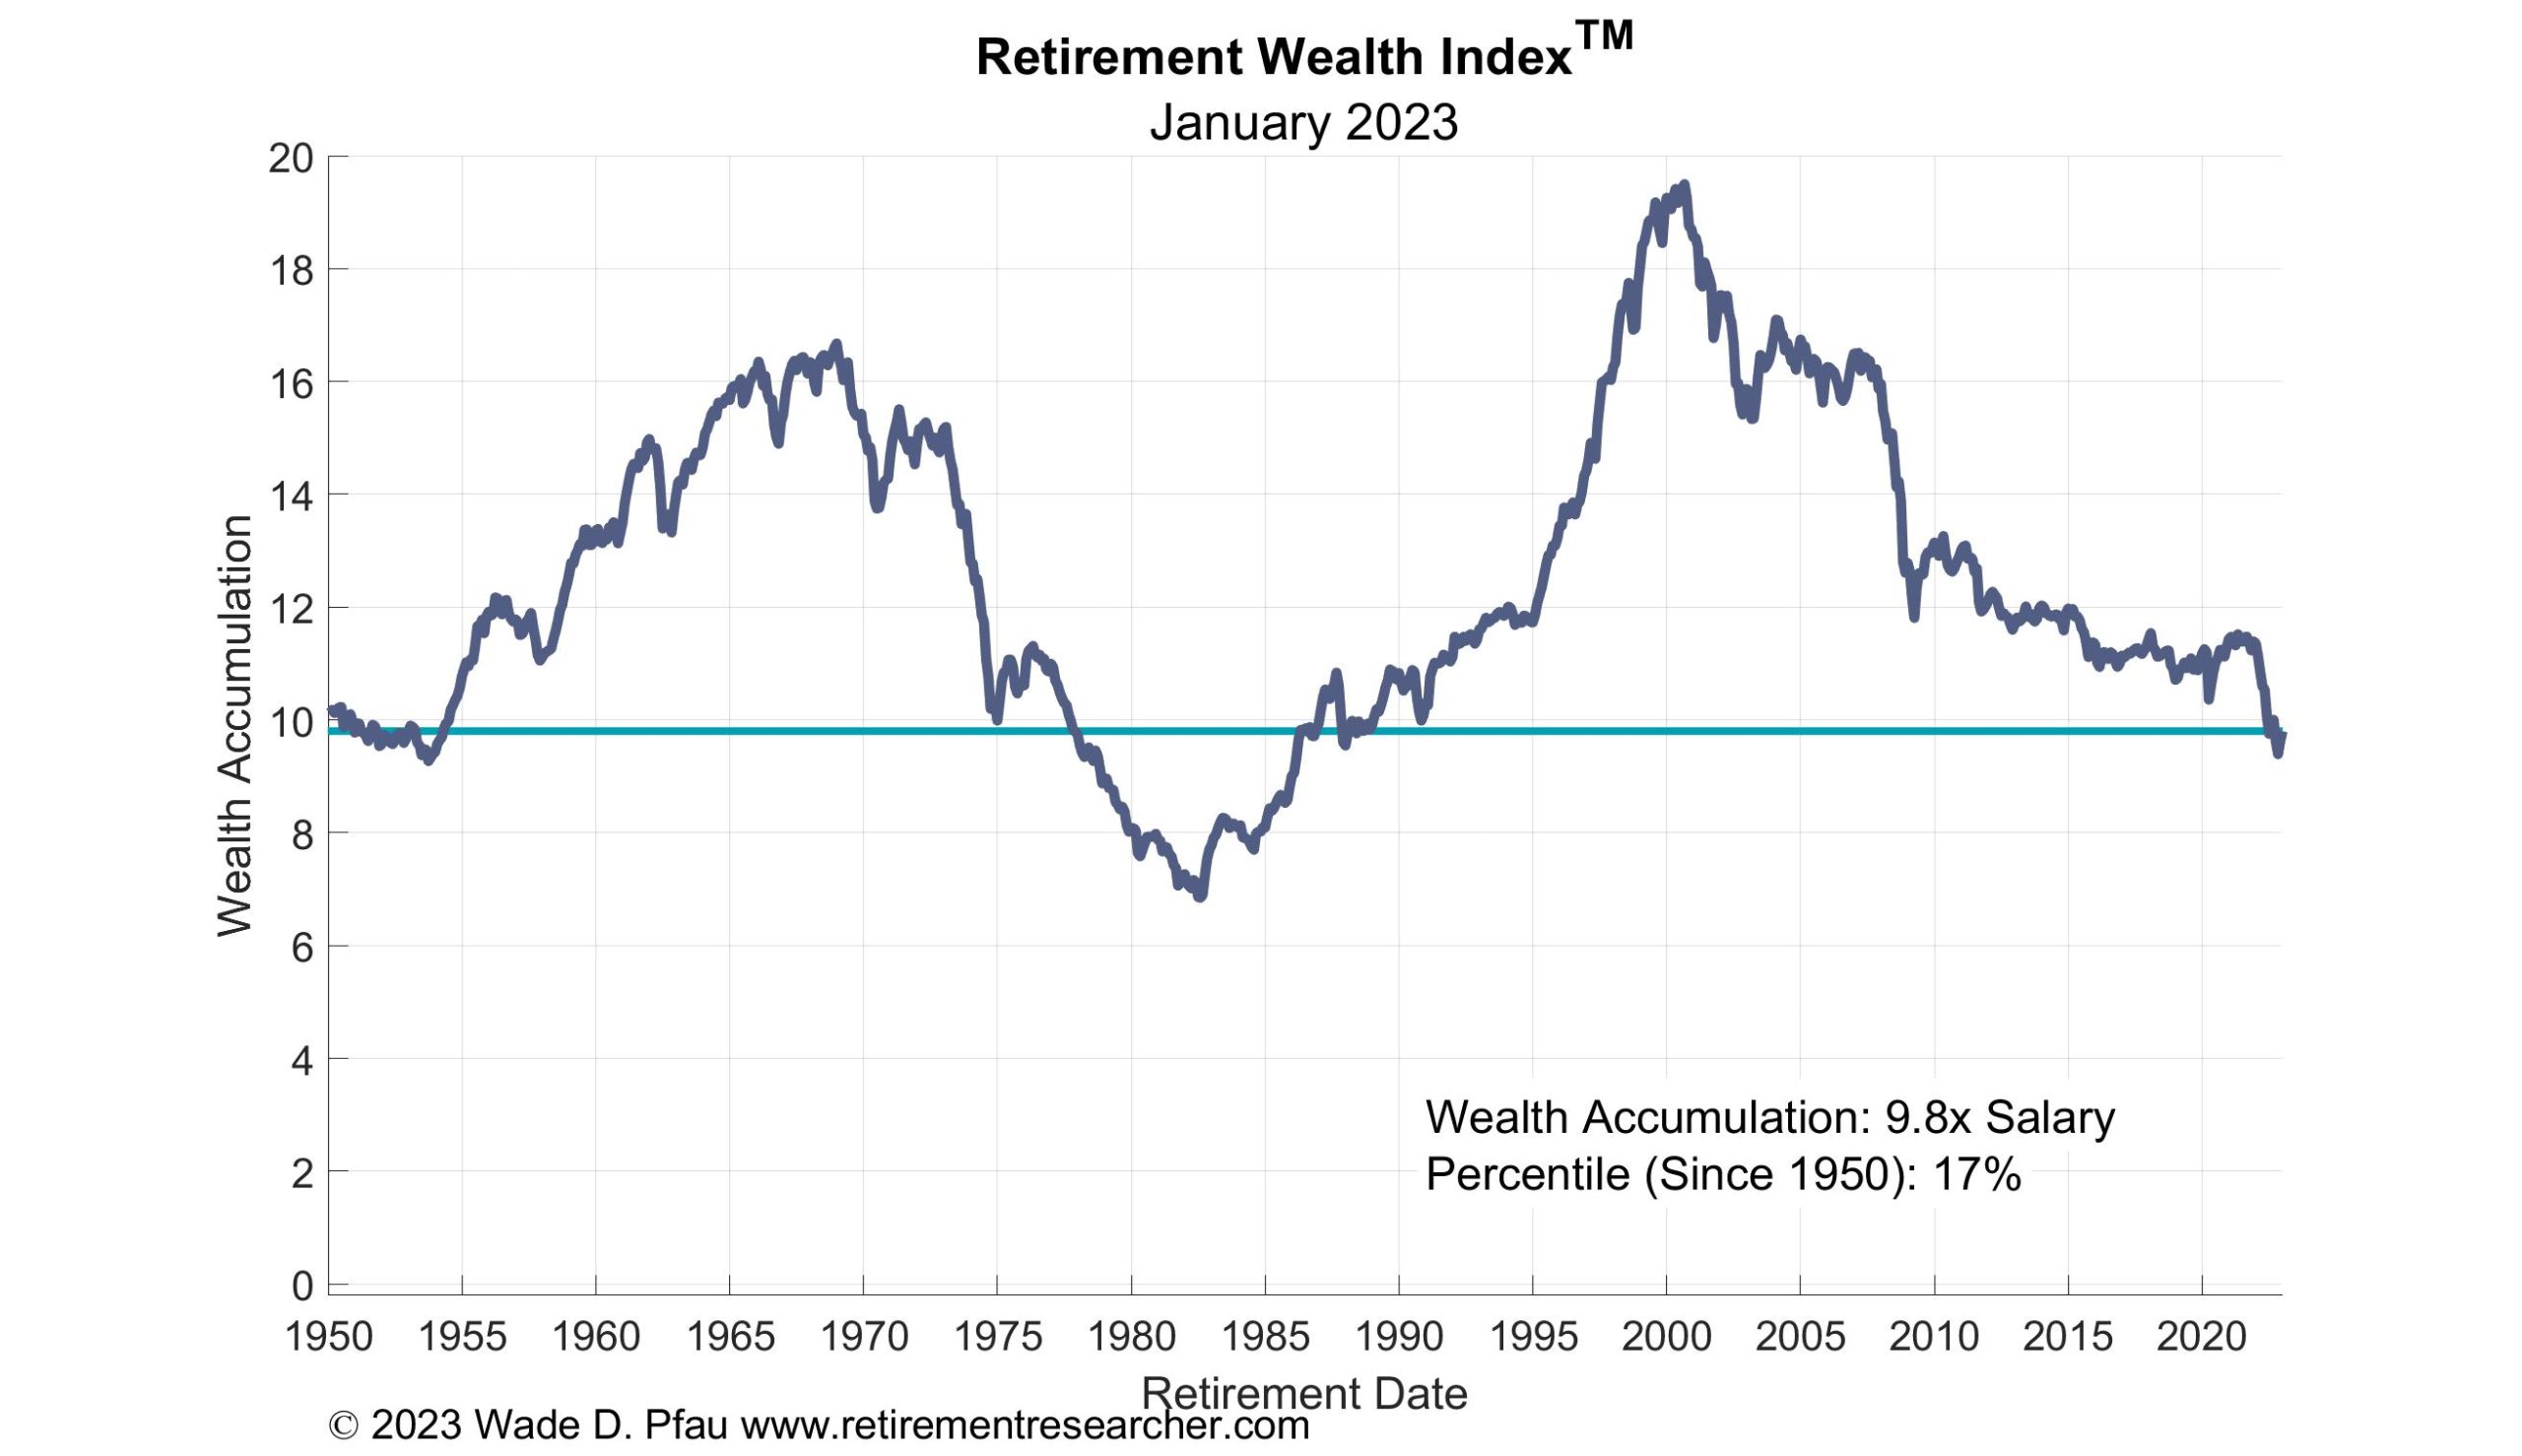
First, the Retirement Wealth IndexTM shows the accumulated wealth (as a multiple of salary in the final working years) for someone saving 15% of salary each year over a 30-year period from age 35 until retirement at age 65.
Next, the Retirement Affordability IndexTM incorporates current market conditions to determine the gross replacement rate from pre-retirement salary which can be sustained with the accumulated retirement wealth. Calculations are based on supporting an inflation-adjusted spending stream over a lifetime using the cost of retirement income shown in the previous chart.
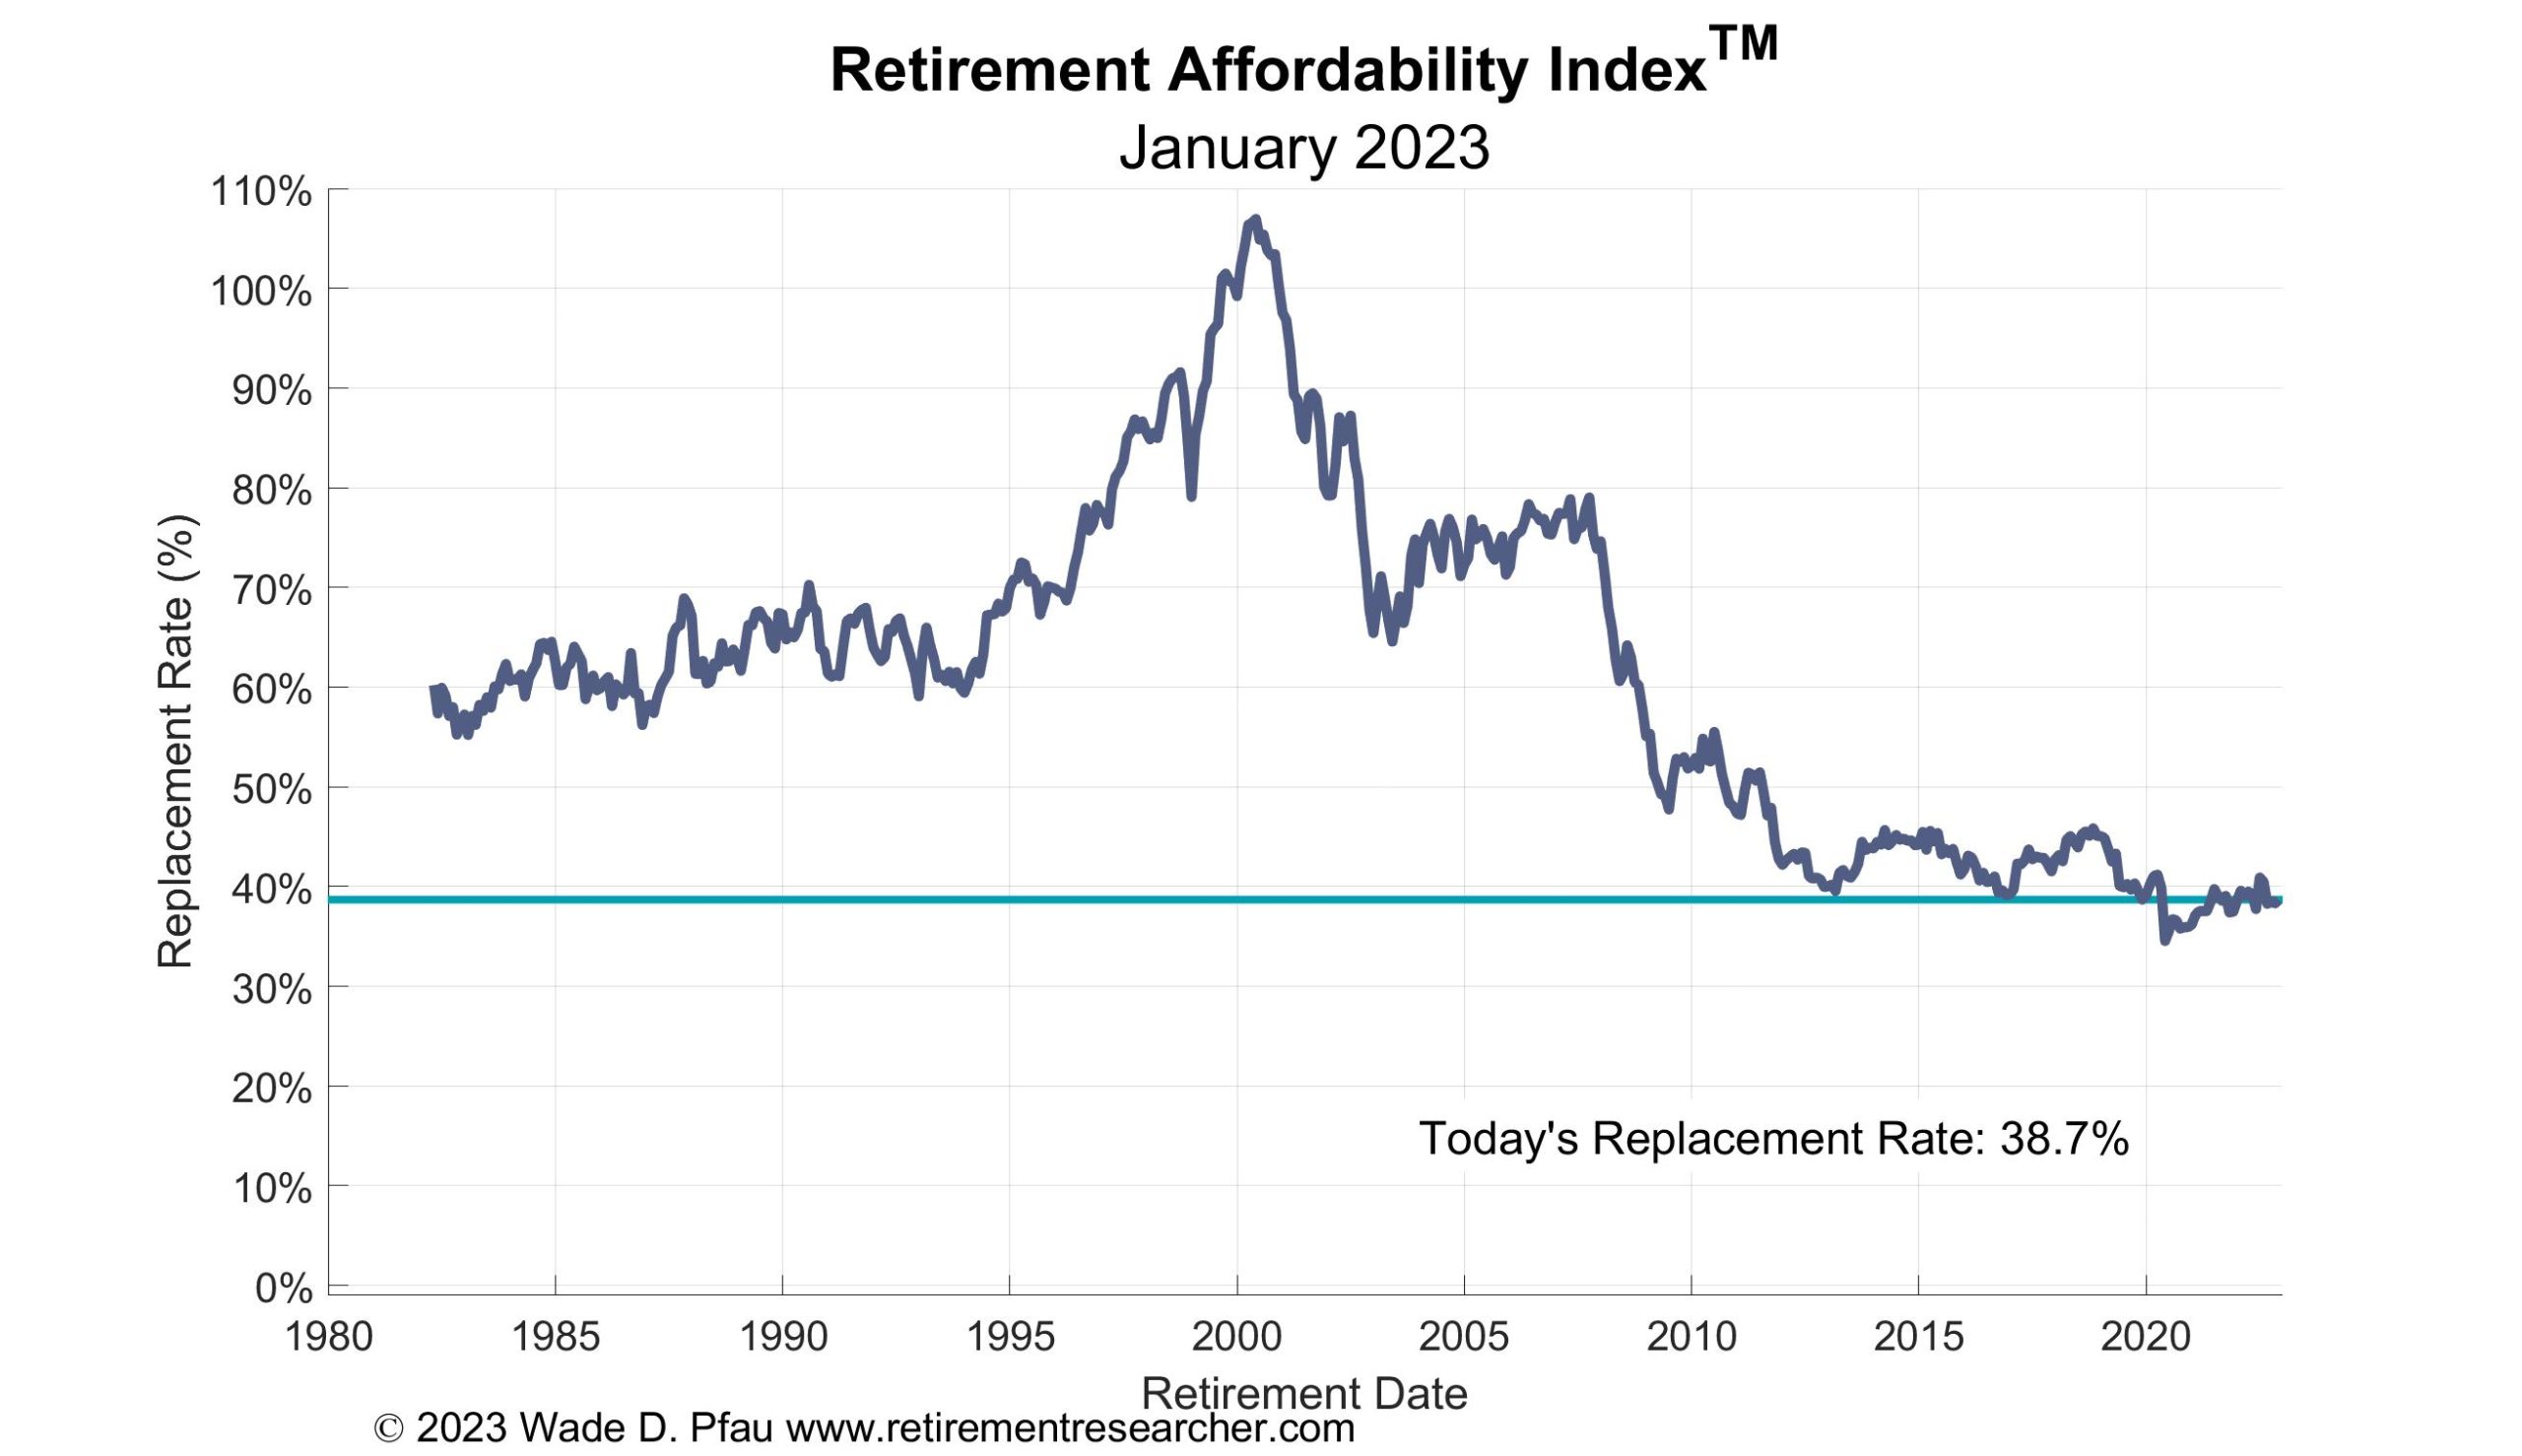
For an example about how these indices work, a retiree whose final salary was $100,000 would have accumulated $980,000 most recently. Given current interest rates and longevity, these retirement savings could purchase about $38,700 of inflation-adjusted lifetime income. This represents at 38.7% replacement rate from pre-retirement salary.
The next table provides information about sustainable spending using dedicated income sources. These include building a bond ladder by holding individual bonds to maturity to support retirement expenses, or purchasing a simple income annuity that turns a single premium into protected lifetime income.
For bonds, we look to building income to support 30-years of retirement spending. Spending rates that work with the full range of available bonds end up matching closely with what the Treasury Department reports as the composite long-term Treasury bond interest rate. As of January 2023, these interest were 4.11% for traditional bonds and 1.78% for Treasury Inflation Protected Securities (TIPS), which support inflation-adjusted spending.
We consider three spending goals over 30 years: Fixed spending that does not grow for inflation, spending that automatically grows each year at 2% as an approximation for inflation, and spending that grows for the actual inflation experience as defined by the Consumer Price Index (CPI). About the assumed 2% spending growth, this used to match what markets expected inflation to be over the long term, though with the January 1 interest rates, the breakeven between the interest rates is 2.33% (4.11% – 1.78%). This explains why I show a higher spending rate than when assuming actual CPI adjustments. These spending numbers are 5.62% for fixed spending, 4.41% for a 2% COLA, and 4.25% assuming the bond ladder is created with TIPS. The disadvantage with these bond ladders is that they will ensure all assets are depleted at the end of 30 years.
This table also shows single-premium immediate annuity payout rates. These numbers provide the average payout from the top three quotes at immediateannuities.com. These quotes are for a couple and provide joint lifetime income at the same level as long as at least one member of the couple is still alive. These quotes are life-only, meaning that beneficiaries do not have the opportunity to receive something if both members of the couple end up not living long. These payout rates are higher, with 6.42 on fixed spending and 5.10% with a 2% cost-of-living adjustment. In the past, some insurance companies provided a CPI-adjusted SPIA, but currently none are available on the market. These numbers are higher than with bonds because annuities allow for risk pooling. The premiums from those who end up not living as long help to support the payments to those who live longer. Retirees can pool their longevity risk instead of trying to self-manage this risk by assuming they may live longer than average (such as for 30 years to age 95).
(1) Sustainable Spending from Dedicated Income Sources
Spending Rates Obtainable for 65-Year Old Couple, January 1, 2023
| Income Growth Factor | 30-Year Bond Ladder | Single Premium Immediate Annuity (SPIA) (Life-Only) |
|---|---|---|
| Fixed (No Growth) | 5.62% | 6.42% |
| 2% COLA | 4.41% | 5.10% |
| CPI-U Adjusted | 4.25% | not available |
Notes: SPIA rates are based on the average of top three quotes from immediateannuities.com using $100,000 of non-qualified funds for a joint and 100% survivors annuity. At this time, no company is offering a CPI-adjusted SPIA. Bond ladder payouts are calculated using the Treasury Department’s long-term interest rate data as an approximation of the average yield available over the course of retirement.
Next, I estimate sustainable spending rates with specified allowances for retirement risk using volatile investment portfolios (stock and bond funds). These strategies have greater downside risk which is why the sustainable spending rate can potentially be less than found with dedicated income. By investing in stocks, retirees hope for greater spending power through market growth, but they have to spend conservatively to self-manage both the longevity risk and the risk that markets do not cooperate and returns are low. If markets do fine, these strategies also have greater upside growth potential to allow for more future spending or to provide a greater legacy.
Attention often turns to the 4% rule, which is a simple rule-of-thumb to guide retirement spending. It is the highest withdrawal rate that would have worked with historical U.S. market returns for someone adjusting their spending for inflation each year and planning for a 30-year retirement.
Spending numbers are divided between conservative, moderate, and aggressive retirees. I define these retirees based on their willingness to invest in stocks (25%, 50%, or 75% stock allocations), and their willingness to see their portfolio decline to low levels (see the table notes).
The table is divided into three parts. First are the spending strategies that are comparable to the dedicated income strategies shown before. We can observe that conservative and moderate retirees would need to spend less to maintain sufficient confidence that their wealth doesn’t fall by too much, but that aggressive retirees could spend more by taking on greater risk that the plan won’t work. Nonetheless, the 4% rule is not applying to the inflation-adjusted spending. For a moderate retiree, 2.93% is the comparable number today. I assume the simulations start from today’s interest rate and inflation levels and that stocks outperform bonds by their average amount historically along with their historical volatility. Since 1926, large-capitalization U.S. stocks outperformed long-term government bonds on average by 6% per year with 20% volatility.
(2) Sustainable Spending from Volatile Investment Portfolios
Sustainable Spending Rates from an Investment Portfolio, January 1, 2023
| Spending Strategy | Conservative | Moderate | Aggressive |
|---|---|---|---|
| Fixed Spending (No Growth) | 3.70% | 4.88% | 5.38% |
| Spending with 2% COLA | 2.73% | 3.80% | 4.24% |
| Inflation (CPI-U) Adjusted Spending (i.e. "the 4% rule") | 1.90% | 2.93% | 3.38% |
| Spending with 2% COLA with Five Years of Buffer Asset | 3.23% | 4.72% | 5.47% |
| Inflation (CPI-U) Adjusted Spending with Five Years of Buffer Asset | 2.23% | 3.62% | 4.29% |
| Guyton and Klinger Decision Rules (Variable Spending) | 3.66% | 5.44% | 5.97% |
Notes: The conservative couple uses a 25% stock allocation and seeks a 95% chance that real wealth will not fall below 10% of its initial level by year 35 of retirement. The moderate couple uses a 50% stock allocation and seeks a 90% chance that real wealth will not deplete by year 30 of retirement. The aggressive couple uses a 75% stock allocation and seeks an 80% chance that real wealth will not deplete by year 30 of retirement. Analysis assumes that withdrawals are made at the start of each year, retirees earn the underlying indexed market returns, and market return simulations are based on capital market assumptions starting from today’s level of interest rates and inflation.
These numbers can look bleak, but not all is lost for today’s retirees. Let’s consider three possible ways to spend more.
The first is with buffer assets. These are resources available outside the financial portfolio to draw from after a market downturn. Returns on these assets should not be correlated with the financial portfolio, since the purpose of these buffer assets is to support spending when the portfolio is otherwise down. The two main buffer assets are to use policy loans with the cash value of whole life insurance (though this would have to have been set up years in advance), or to open a line of credit with a reverse mortgage. By helping to reduce the need to take distributions from the portfolio when it is in trouble, buffer assets can support a higher spending rate with the same level of sustainability. I include spending rates from the investments assuming a buffer asset holding five-years worth of spending power, and that spending is sourced to the buffer asset in any year that the remaining portfolio balance fell below its initial level at the start of retirement. For moderate retirees, the buffer asset raised the spending rate from 3.8% to 4.72% for spending with the fixed cost-of-living adjustment, and from 2.93% to 3.62% for inflation-adjusted spending.
The next way to spend more is to use a variable spending strategy. Spending can start higher, but only because there is a built-in willingness to cut spending as necessary. There are many possible variable spending strategies. I include the Guyton and Klinger decision rules in the table because they are probably the most famous. This strategy assumes inflation-adjusted spending, but the inflation adjustment is skipped in years after the portfolio experiences a loss, and spending is further cut by 10% permanently at any point in the first 15 years of retirement that the withdrawal rate from remaining assets has risen more than 20% above its initial level due to a declining portfolio balance. In a bad market, there could be several of these permanent 10% spending cuts. In the other direction, spending can also increase by 10% whenever the portfolio grows sufficiently so that the current withdrawal rate is more than 10% lower from where it started. These rules are complicated and will require careful monitoring with a spreadsheet, but we can see that applying these spending rules allows a moderate retiree to increase spending to 5.44%.
Finally, we could consider a case that integrates insurance and investments. To be consistent, let’s suppose a spending goal with 2% spending growth throughout retirement. Using only investments, a moderate couple would be looking at a 3.8% spending rate. Suppose they place 30% of their assets into a SPIA. It offers a 5.1% withdrawal rate. Also, because they now have this downside protection for their spending, they start to relax more about market volatility and feel that they can behave more aggressively with their remaining investments. That moves them to a 4.24% withdrawal rate. Blending the annuity and the investments, their combined withdrawal rate increased from 3.8% to 4.5%. Because bonds are really the least efficient way to support retirement spending, this type of integrated strategy would work even better for conservative retirees. And while I considered SPIAs here, there are other available annuity options that preserve liquidity and upside such as variable or indexed annuities that include a protected lifetime income benefit.
Underlying Market Assumptions Table
U.S. Government Yield Curve
(Constant Maturity January 1, 2023)
| Maturity | Treasury Yield | TIPS Yield | Implied Breakeven Inflation Rate |
|---|---|---|---|
| 1 Year | 4.73% | 1.34% | 3.39% |
| 5 Years | 3.99% | 1.66% | 2.33% |
| 10 Years | 3.88% | 1.58% | 2.30% |
| 20 Years | 4.14% | 1.62% | 2.52% |
| 30 Years | 3.97% | 1.67% | 2.30% |
| Long-Term Average Rate | 4.11% | 1.78% | 2.33% |
Source: US Department of Treasury, except 1 Year TIPS Yield is an estimate of the one-year real yield from the Cleveland Federal Reserve Bank

