The VIX Index is one of those things people mention to sound smart. It’s just obscure enough that most people have heard of it, have some inkling of what it is, and feel like they should understand – but they don’t really get it.
In short, the VIX Index is the market’s estimate of what the volatility of the S&P 500 Index will look like over the next month.
The VIX has been in the news a decent amount recently. While we aren’t at the record lows we saw a little while ago, the VIX is still pretty low – it’s only at about two-thirds of the index’s long term average.
The question I want to explore today is this: Does this actually tell us anything? Should we expect the S&P 500 Index (and by extension, the market) to be more volatile over the next month or so?
Let’s take a look at the numbers. Before we test how much trust we should put in the VIX, let’s set up a control. How well does the volatility of the S&P 500 Index over the previous twenty trading days predict the volatility of the S&P 500 Index over the next twenty(1)? If the VIX can’t beat this, then it’s worthless.
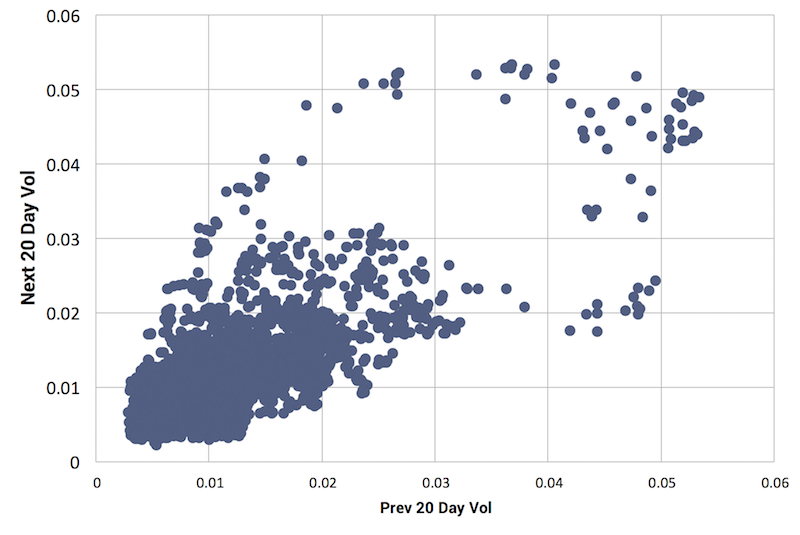
Data from 1/3/90-8/21/17. Volatility represented by standard deviation of the daily returns. Past performance is not indicative of future returns. Indices are not available for direct investment. Data from Yahoo!Finance.
Just eyeballing the data, it’s obvious there is a connection between the previous and future volatility, but it’s not the tightest relationship. In fact, the volatility of the previous twenty days explains a little more than half of the variance in the volatility of the next twenty days.
It’s something to work with, but certainly not something to bet on (note: market timing is bad). If volatility has been high recently, then it’s likely to stay high (at least for a little while), and vice versa.
Now that we have our baseline, let’s look at how well the VIX actually predicts future volatility.

Data from 1/3/90-8/21/17. Volatility represented by standard deviation of the daily returns. Past performance is not indicative of future returns. Indices are not available for direct investment. Data from Yahoo!Finance.
Again, just by eyeballing the chart, you can see both that there is a relationship between the VIX and the subsequent volatility, and that the relationship is stronger than the one between previous and subsequent volatility. Where the previous volatility explained a little more than half the variance of future volatility, the VIX explains almost 80 percent of it. These are rolling numbers, so these likely overstate the “true” effect, but there’s clearly something here.
If you step back and think about what’s going on, it makes sense that the VIX has some predictive power. In fact, if it didn’t, then pretty much everything we know about finance would be wrong.
Think about stock prices. If the market says a share of Apple costs $160, that is a rough reflection of the equilibrium price people are willing to buy and sell a share of Apple at – given the currently available information and prevailing expectations about the future. Since their money is at stake, most traders are doing their absolute best to figure out the “true” value of Apple.
This price discovery is the real magic of the market. With everyone coming together to try to outsmart each other, the market processes everyone’s pushing and pulling (with all of the unique information that everyone has), resulting in an equilibrium price.
Notice that I didn’t say the correct price. There’s no perfect price for a share of Apple – or rather, it is completely unknowable and wouldn’t matter anyway as the “perfect” price is constantly shifting based on new information. The trick here is that while we know that share prices aren’t right, we don’t know if they are too high or too low. Either way, the price is pretty close – and you probably couldn’t do better anyway.
It’s the same thing with the VIX. The VIX Index is computed from a number of options contracts on the S&P 500 Index.
Options pricing is fascinating, but entirely beyond the discussion here – except for the fact that the assumed volatility of the underlying asset (in this case the S&P 500 Index) is one of the main drivers of the options price. It’s also the only unknown variable (at least in the Black-Scholes option pricing model), so you can extract the market’s implied volatility from the price of the option. You have the market coming together, and – through the same price discovery process we see with stock prices – coming up with the market’s assumption of future volatility.
Now, just like with stock prices, the market isn’t going to get it exactly right (remember, the VIX only explains about 80 percent of the variance in future volatility), but it does a pretty good job of predicting future volatility (the VIX explains about 80 percent of the variance in future volatility.)
This is fun from a financial theory perspective, but what does it actually tell us about how we should manage money?
Not much.
If you’re a short-term trader, you care about the VIX a lot. But for folks focused on retirement and investing for the long term, it doesn’t provide much useful information. Month to month, even year to year returns are largely random. You want to focus on harvesting the long-term sources of expected returns that can drive your retirement portfolio. How volatile the market happens to be over the next month or so doesn’t have any effect on what you should be doing.

(1) Twenty trading days is the typical approximation of a month.


