Adjustments for Current Bond Yields
An important consideration is that current interest rates are lower than the historical averages. The historical average return is not relevant for someone seeking to estimate future market returns from today’s starting point. The general problem with attempting to gain insights from the historical outcomes is that future market returns are connected to the current values for the sources of market returns, rather than to their historical performance.
Returns on bonds depend on the initial bond yield and on subsequent yield changes. Low bond yields will tend to translate into lower returns due to less income and the heightened interest rate risk associated with capital losses when interest rates rise. Decreasing interest rates provide the only mechanism for bond returns to outpace bond yields, but this can only go so far when bond yields already start low.
Exhibit 1.1 demonstrates that, historically, the relationship between interest rates and subsequent bond returns has been tight. The exhibit shows the relationship between bond yields and the subsequent average annualized returns on bonds over the next five years using the Morningstar and Ibbotson Associates Intermediate-Term Government Bond (ITGB) index data since 1926 as a proxy for bonds. Much of the variation in intermediate-term government bond returns over the subsequent five years can be explained by their current yield. The year 2019 began with five-year Treasury yields at 2.5 percent. This is 2.7 percent less than the historical average ITGB return of 5.2 percent. This type of analysis suggests that the most reasonable return assumption for retirements beginning at the start of 2019 is that these bonds will average 2.5 percent returns rather than 5.2 percent returns.
Exhibit 1.1 The Relationship Between Bond Yields and Subsequent Bond Returns
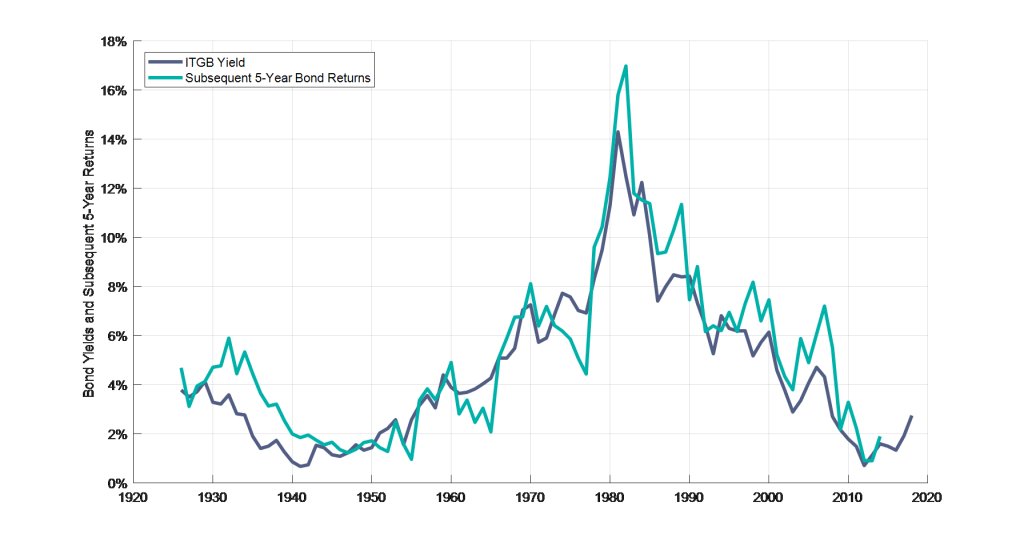
Source: Own calculations from SBBI Yearbook data provided by Morningstar and Ibbotson Associates. Bonds are represented by intermediate term US government bonds.
In order to maintain the same risk premium for stocks over bonds, it would be necessary to reduce the return assumption for stocks by the same amount. Even if interest rates were to increase later in retirement, sequence-of-returns risk describes how it is the upcoming returns that matter most, making this adjustment for returns necessary to obtain a more realistic picture about retirement sustainability.
Adjustments for Market Valuations
A common way to estimate stock returns is to add an equity premium to a bond yield. This technique for estimating returns is known as the capital asset pricing model. This model was developed by William Sharpe in the 1960s, and he was awarded a Nobel Prize in economics for his work in 1990 alongside Harry Markowitz.
The model posits that the expected return on a financial asset is equal to a risk-free rate of return plus a risk premium multiplied by a factor showing the relationship between the asset and the overall market portfolio. For an overall market index like the S&P 500, this suggests that its return should be equal to the return provided by low-risk assets like Treasury bonds plus a risk premium to account for the volatility of stocks.
We have discussed how bond yields are the best predictors for subsequent bond returns. Historically, the S&P 500 outperformed intermediate-term government bonds by 6.7 percent in arithmetic terms. Lower bond yields suggest one reason why stock returns could be less. Adding 6.7 percent to the 2.5 percent bond yield at the start of 2019 would lead to an estimate for stock returns of 9.2 percent, compared to the historical 11.9 percent arithmetic average return. With low bond yields we should also expect lower stock returns as well. Otherwise, stocks would end up providing a higher return premium over bonds than they have historically, and there is little reason to expect a higher risk premium today.
It is also worth addressing estimates of the equity premium. Are the historical excess returns really the best predictors for the future equity premium? An important matter to address is the relationship between the equity premium and the cyclically adjusted price-earnings ratio. When price-earnings multiples are high, markets have historically tended to exhibit mean reversion as relatively lower future returns were realized, and vice versa.
In the mid-1990s, Yale professor and Nobel laureate Robert Shiller popularized the concept of the cyclically adjusted price-earnings ratio (commonly abbreviated either as CAPE or PE10) as being a useful predictor of subsequent stock market returns. The PE10 measure is the stock price divided by the average real earnings on a monthly basis over the previous ten years. A research article published by John Campbell and Robert Shiller in 1998 justifies this measure to remove cyclical factors from earnings, though there is no particular reason to pick precisely ten years other than as an approximation for the length of a business cycle. Today, Robert Shiller provides updated data on the key variables used to calculate PE10 at his website.
Though Robert Shiller focused on the relationship between the PE10 measure and subsequent stock returns, the approach can just as easily be applied to the relationship with the equity premium. The idea with both is that when the PE10 measure is higher, subsequent expected stock returns or their excess returns over bonds should be less.
The historical risk premium can vary based on the historical period under consideration as well as on the choice of stock and bond indices. Robert Shiller provides freely on his website data for US large-capitalization stock returns, dividends, and earnings, as well as ten-year Treasury bond yields. This data is available since 1871, making it the longest available data series commonly used for retirement income research.
In this dataset, large-capitalization stocks provided an average 5.8 percent higher arithmetic return than ten-year bond yields. This is one way to estimate the equity premium. Exhibit 3.9 parses this historical data in another way, however. It plots the values of PE10 at each historical point against the arithmetic average of the risk premium over the subsequent ten years. The line fitting best through this data shows a negative historical relationship as higher values of PE10 are associated with lower subsequent excess returns for stocks over bonds. To the extent that we view this model as having credible predictive power, it suggests that the best guess for the risk premium over the next ten years from January 2019 is only 1.4 percent, rather than the historical average 5.8 percent. This lower risk premium results from the higher market valuations facing retirees at the present, as PE10 was 28.64 in January 2019, compared to its historical average of 17.0. This projection is well below the historical average because PE10 is well above its historical average.
Exhibit 1.2 The Relationship Between the Cyclically Adjusted Price-Earnings Ratio and the Risk Premium
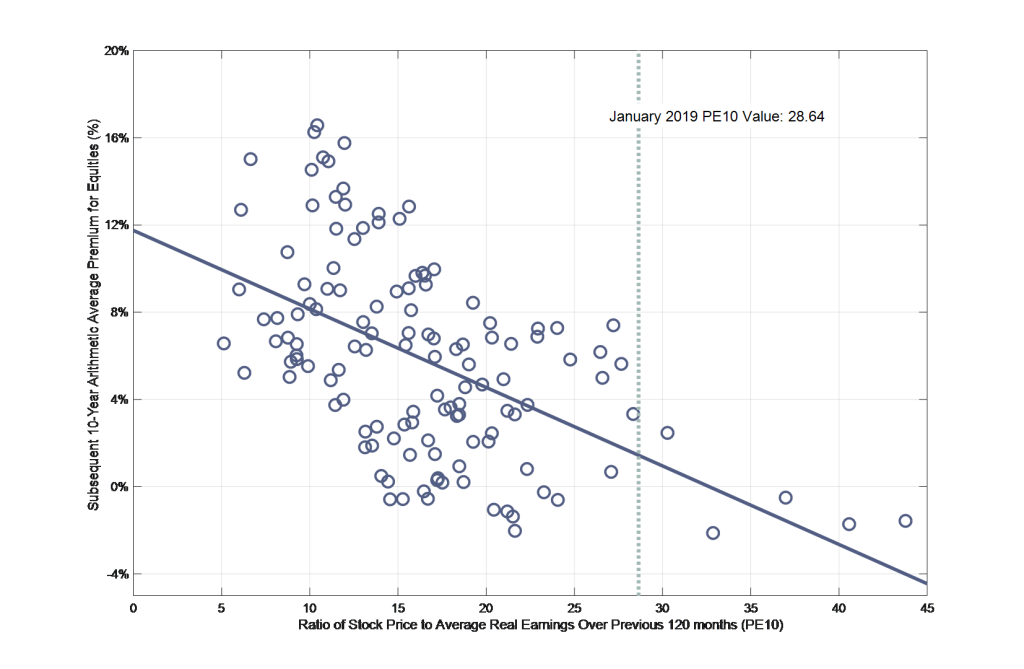
Source: Own calculations with data from Robert Shiller’s website (http://www.econ.yale.edu/~shiller/data.htm).
There is more controversy about the predictive powers of PE10 for stock returns, or their excess returns over bonds, than there is for bond yields to predict bond returns. There are compelling behavioral explanations for why these relationships could remain in the future, but there are also many arguments specifically about the problems with using PE10. For instance, changing accounting standards with regard to how earnings are calculated may be an explanation for why today’s PE10 does not properly align with its historical values.
William Bernstein has also written about the paradox of wealth, which is that returns on capital tend to decrease as societies become wealthier. He tracks this trend back to the middles ages. This could explain why we should expect PE10 to center around a higher level than in the past as the returns on capital fall. A related argument along these lines is that low interest rates could also justify a higher value of PE10 than otherwise. Nevertheless, this issue of market valuations exemplifies why it may not always be wise to use historical averages for excess returns to create estimates for the future risk premium.
Sustainable spending rates for retirees are intricately related to the returns provided by the underlying investment portfolio. And with sequence-of-returns risk, the returns experienced early on will weigh disproportionately on outcomes. In other words, for those already spending, the assumption that returns will one day normalize to their historical averages is much less relevant than it is for accumulators who will rely on more distant market returns. Current market conditions are much more relevant, making it a mistake to blindly apply a historical average return without further thought.

This is an excerpt from Wade Pfau’s book, Safety-First Retirement Planning: An Integrated Approach for a Worry-Free Retirement. (The Retirement Researcher’s Guide Series), available now on Amazon.


