[Introductory note: Part III of William Bernstein’s classic 5-part “Retirement Calculator from Hell” series provides particularly relevant background reading for this post.]
An argument made in support of the 4% rule is that despite what I argued before, post-1926 U.S. history did include a number of calamitous market events, such as the Great Depression and the Great Stagnation of the 1970s. As such, it is hard to imagine an even more dire situation awaiting future retirees. The historical success of the 4% rule suggests that we can reasonably plan for its continued success in the future.
My first foray into researching about personal retirement planning was a study about the sustainability of the 4% rule in other developed market countries. Here I will provide further perspective about the results described in my article, “An International Perspective on Safe Withdrawal Rates: The Demise of the 4% Rule?” from the December 2010 Journal of Financial Planning.
From an international perspective, a 4% withdrawal rate has been problematic. In the original article, to avoid claims of bias that I choose an asset allocation which exaggerates the risk of the 4% rule, I used a rather generous and unrealistic “perfect-foresight assumption.” For each country and in each retirement year, I used the asset allocation (between stocks, bonds, and bills) which supported the highest withdrawal rate. Though not always, in many cases this meant using 100% stocks. With the perfect-foresight assumption and an updated dataset which includes two more countries, the calculated SAFEMAX (this is the maximum sustainable withdrawal rate over 30-years in the worst-case scenario from a country’s history) exceeds 4% in Canada (4.4%), New Zealand (4.1%), Sweden (4.1%), Denmark (4.1%), the GDP-weighted world portfolio (4.1%), and the US (4%).
The perfect foresight assumption is quite unrealistic, though, and here I will focus on a more plausible 50/50 retirement asset allocation. In terms of the SAFEMAX, 50% stocks and 50% bills generally outperforms 50% stocks and 50% bonds. For this reason, I will further consider results for the stocks and bills case. Though not shown here, I do also note that stock allocations below 50% support lower SAFEMAXs in all countries except Switzerland and Sweden. The results for 50/50 are in Table 3.2.
With a 50/50 asset allocation, the 4% rule did not survive in any country, though it came close in the U.S. and Canada, with support for 29 years of expenditures and a SAFEMAX just below 4%. Even allowing for a 10% failure rate, 4% made the cut only in Canada, the US, New Zealand, Denmark, and the GDP-weighted world portfolio. In 10 of 19 countries, the SAFEMAX fell below 3%. World War II era Japan, in particular, faced the sort of crisis suggested by William Bernstein, as the SAFEMAX was only 0.26% for 1937 retirees. The 4% rule would have supported expenditures for only 3 years. Shockingly, the 4% rule would have failed more than half of the time for countries including Spain, Belgium, Germany, France, and Italy. Italians attempting to use the 4% rule would have actually faced failure in 80.5% of cases. The table also shows results for a 5% withdrawal rate, and failures rates are substantially higher than for 4%. Even if the 4% rule could somehow be deemed as safe, there is clearly not much room for error when seeing how quickly failure rates rise for 5% withdrawals. I do not use hyperbole when suggesting that the results in this table do not portray the 4% rule in a positive light.
To expand the previous table further, Figure 3.2 shows a boxplot of the distribution of withdrawal rates for each country, ranked by order of their SAFEMAX from smallest to largest. For each country, the red central marker is the median, the edges of the box are the 25th and 75th percentiles, and the whiskers extend to the most extreme datapoints not defined as outliers. Outliers are plotted individually. This figure does provide a broader view about the range of outcomes for each country.
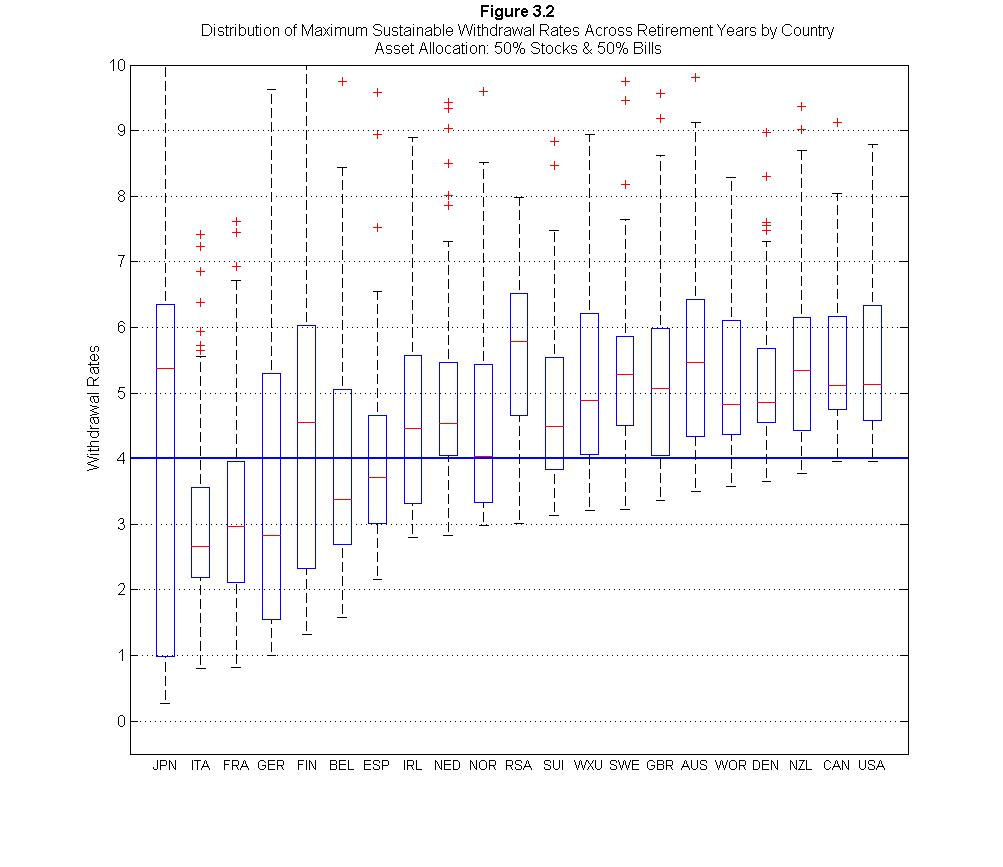
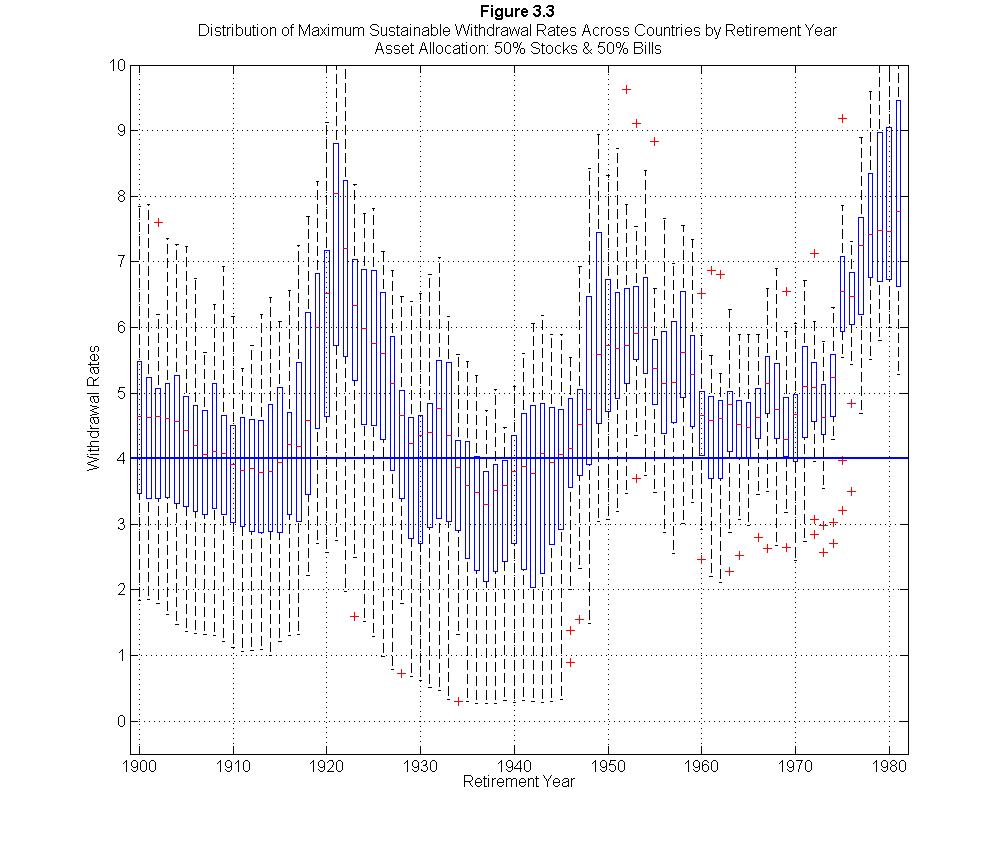
Figure 3.3, meanwhile, shows the distribution of withdrawal rates across countries for each retirement year. From this figure, we can see the contemporaneous correlation of withdrawal rates across countries and also observe general historic trends. In recent years, those who have challenged the 4% rule are sometimes accused of falling victim to recency bias, placing too much weight on the poor financial market conditions of the recent past. However, Figure 3.3 suggests that recency bias may instead be responsible for too much faith in 4%. Across countries, the median sustainable withdrawal rate was under 4% in many cases prior to about 1945. Since World War II, however, the median outcome never fell below 4%, and in only a few cases did the 25th percentile fall below 4%. Indeed, in recent years the performance of the 4% rule across countries was much stronger than the earlier part of the historical period. While some of the worst outcomes can be connected with World Wars I and II, given the broader view of history suggested by William Bernstein, is it appropriate to ignore those cases? Whether there are important structural changes which might explain why the earlier period is less relevant to today’s environment is an exercise to be left for the reader’s interpretation.
Keep in mind also that I am only looking at the 19 developed market countries in the dataset, with data going back to 1900. Travel back in time to 1900, though, and ask people to put together a list of 19 developed market countries for the 20thcentury, and you would probably find frequent mention of countries like Argentina, Russia, and China, among others. As those countries never made the dataset, even the results I describe here include survivorship bias.
From the perspective of a U.S. retiree, the issue is whether the future will provide the same asset return patterns as in the past, or whether Americans should expect mean reversion that would lower asset returns to levels more in line with what many other countries have experienced. And for international readers, do keep in mind that the 4% rule is based on U.S. historical data, and mileage may vary quite dramatically in other countries.
It may be tempting to hope that asset returns in the 21st century United States will continue to be as spectacular as in the last century, but John Bogle cautioned his readers in his 2009 book Enough, “Please, please, please: Don’t count on it.”