Understanding the relationship between bond risk and time to maturity and duration of a bond provides the basis for understanding the bond yield curve. The yield curve shows the yields to maturity for a series of bonds—typically US Treasury bonds—with the same credit quality but different maturity dates, along with the term structure for interest rates.
Exhibit 1.1 provides an example of the yield curve for Treasury Bonds and for TIPS on May 1, 2019.
Exhibit 1.1: US Government Yield Curve for Constant Maturity Bonds and TIPS, May 1, 2019
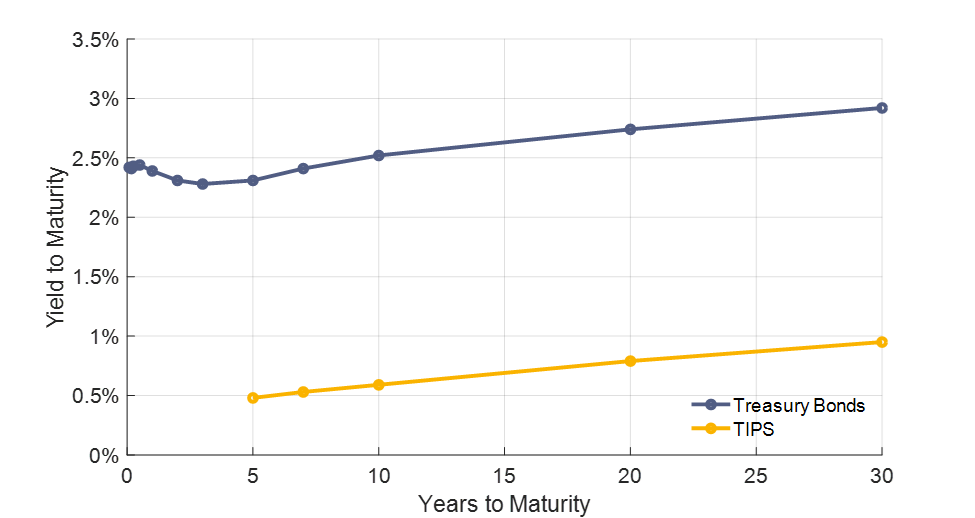
Bonds with more distant maturity dates typically offer higher interest rates than bonds with earlier maturity dates. This is not always the case, but in the exhibit, we do see this effect, even though it is more muted than usual. For treasuries, a thirty-year treasury was yielding 2.92 percent while a five-year treasury was yielding 2.31 percent, for instance. Likewise, with TIPS the real yield for a thirty-year maturity was 0.95 percent, compared with 0.48 percent for a TIPS with a five-year maturity.
For additional information, click here to download our ebook, the 7 Risks of Retirement Planning.
Longer-term bonds experience bigger price fluctuations as interest rates change. When interest rates increase, the price of existing bonds on the secondary market falls in order to calibrate the yield investors will receive from owning existing bonds with the yields being offered by newly issued bonds at the higher interest rates. Bonds that mature sooner are less exposed to this price risk. Thus, shorter-term US Treasury securities are generally considered to be among the lowest-risk investment assets when annualized volatility represents the measure of risk, which means they tend to be offered at a lower yield. Higher yields accompany longer-term bonds, as investors need an added incentive to accept the higher price risks.
The shape of the yield curve is molded by two theories. First, expectations theory suggests that the shape of the yield curve should be reflected by beliefs about future short-term interest rates. For example, investing in bonds over ten years can be done in two ways:
- Buy a ten-year bond, or
- Buy a one-year bond and then reinvest in a new one-year bond after one year, continuing with a succession of ten one-year bonds.
For markets to be in balance, these two strategies should offer the same expected return to an investor, meaning that the combined impact of one-year rates over ten years should match the rate for a ten-year bond. An inverted yield curve where short-term rates exceed long-term rates can be understood as a clear expectation that short-term interest rates will fall in the future. Since interest rate fluctuations are extremely difficult to predict, the expectations theory alone would probably leave the average yield curve relatively flat.
The other theory to determine yield curve shape is the liquidity preference theory,which suggests a need for a risk premium to be offered for longer-term bonds to account for their increased interest rate risk and price volatility, as discussed. Longer-term bonds are less liquid, as well, since this price risk could force them to be sold at a loss if an unexpected expense arose. With this risk premium added to the expectations theory, the typical or neutral shape for the yield curve becomes upward sloping.
With TIPS, we now have a better idea of market expectations for future inflation, though I would not call it perfect. TIPS offer a break-even inflation rate, defined as the difference in yields on the same maturity of traditional treasuries and TIPS. TIPS yields may not reflect the true underlying real interest rate because they have a few other components built into their pricing, such as a premium for their relative illiquidity as they represent a smaller market than treasuries, and a potential additional premium for the protection they provide against unexpected high inflation.
Despite the other factors of TIPS pricing, the difference between Treasury and TIPS rates for the same maturity represents a reasonable market estimate of future inflation expectations. Exhibit 1.2 uses the same data as in Exhibit 1.1 to find this difference.
Exhibit 1.2: US Government Yield Curve and Implied Break-Even Inflation, May 1, 2019
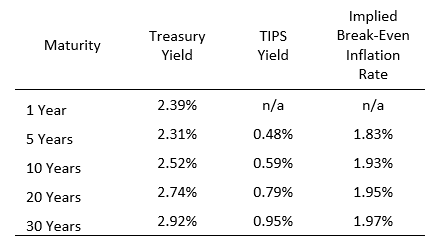
Again, we see with the thirty-year maturity that treasuries yield a nominal 2.92 percent. Its real yield is unknown and depends on realized future inflation. Meanwhile, a thirty-year TIPS offers a real yield of 0.95 percent. Its nominal yield is unknown, as it also depends on realized future inflation. The difference between these yields is the implied break-even inflation rate: 1.97 percent, or approximately 2 percent. Without a liquidity or inflation-protection premium, this represents the market’s equilibrium estimate of future inflation. Over the next thirty years, the markets have priced in expectations for inflation of about 2 percent.
If realized annual inflation exceeds 2 percent over the next thirty years, then TIPS will outperform treasuries. But if inflation falls short, TIPS will underperform. If enough traders thought inflation would be higher than this, they would buy TIPS and sell treasuries, raising the price of TIPS today, and giving us lower TIPS yields, higher treasury yields, and a larger break-even inflation rate. Such trading would continue until the market reaches the equilibrium we observe.
Traditional bonds are priced around the objective of getting a return that exceeds expected inflation. If inflation is unexpectedly high, then the real return on nominal bonds is less. TIPS, on the other hand, keep pace with higher inflation because it triggers a higher nominal return above their underlying real interest rate. Essentially, TIPS provide protection from unexpected inflation. They outperform treasuries when inflation exceeds the implied break-even inflation rate.
This is a valuable attribute when spending is expected to grow with inflation. Traditional bonds outperform if inflation is unexpectedly low. Low inflation also makes it easier to meet retirement spending goals, so this outcome is less in need of protection. Retirees generally get more use from insurance that protects from high inflation, making TIPS a more natural candidate for retirement portfolios. In short, TIPS provide retirees with reliable, inflation-adjusted income that will maintain its real purchasing power.

This is an excerpt from Wade Pfau’s book, Safety-First Retirement Planning: An Integrated Approach for a Worry-Free Retirement. (The Retirement Researcher’s Guide Series), available now on Amazon.


