Last time, we looked at what market valuations are, and discussed why they can be valuable. This time, I want to think about how they can actually be useful. So, what can you do with them?
Not nearly as much as many people would like to believe.
Start with the Positives
I want to start with the positives. As I said, there is value in market valuations. They are great tools that can help you form a (wildly) rough estimate of future expected returns compared to historical returns. When you buy a stock, you’re buying a claim on all of the future cash flows of that company. It stands to reason that, assuming the company’s future cash flows stay constant (which is a herculean assumption), the more you pay for a stock, the lower your future returns will be. And this same logic flows through to market valuations – IF you keep in mind that these are very rough estimates, and they are only valid over the long-term.
So long as you keep these provisos in mind, being able to make a somewhat reasonable estimate as to whether stock returns are likely to be higher or lower than they have been in the past can be a useful tool in figuring out what your asset allocation should look like over the long-term. Keep in mind that long-term here doesn’t mean the next few years, it means the next few decades.
Here’s the thing though – market valuations are not static things that change once every thirty years; they are constantly changing. Our natural instinct is to “update” our assumptions (and what our portfolio looks like) given this new information…But this is where the trouble starts.
Once we start to go down this road, we’re trying to turn something that is informative over the long-term into a short-term indicator, and that just doesn’t work. It’s market timing – just with a respectable, academic, coat of paint slapped on. There’s some good value to be had thinking about market valuations, but only if you use them appropriately.
The data shows very clearly that market valuations, or at the very least the CAPE ratio, is not a reliable guide to future short-term returns.
High Valuations Don’t Mean Low Near-Term Returns
If we’re going to use the CAPE ratio to tell us how we should adjust our portfolio, where it currently is should tell us something about subsequent returns.
This is actually pretty straight forward to test. What I want to see is if the average return is lower when the CAPE Ratio is higher than the average return over the entire time period. However, there are a couple wrinkles that I want to consider.
1. I only want to consider what a CAPE ratio looks like compared to what has previously happened. If I’m looking at a data point in 1948, I don’t want to worry about the fact that CAPE ratios are a lot higher now than they were then.
2. Since, as we discussed last time, the market has changed through time, I want to see if comparing the CAPE ratio over differing lengths of time will have an effect.
Below are the subsequent monthly average annual returns of the S&P 500 Index when the CAPE ratio is greater than or equal to certain percentage thresholds of the maximum CAPE ratio value to that point in time. To put this in perspective, the average annual return of the S&P 500 Index from 1926 through 2017 was 12.06%.
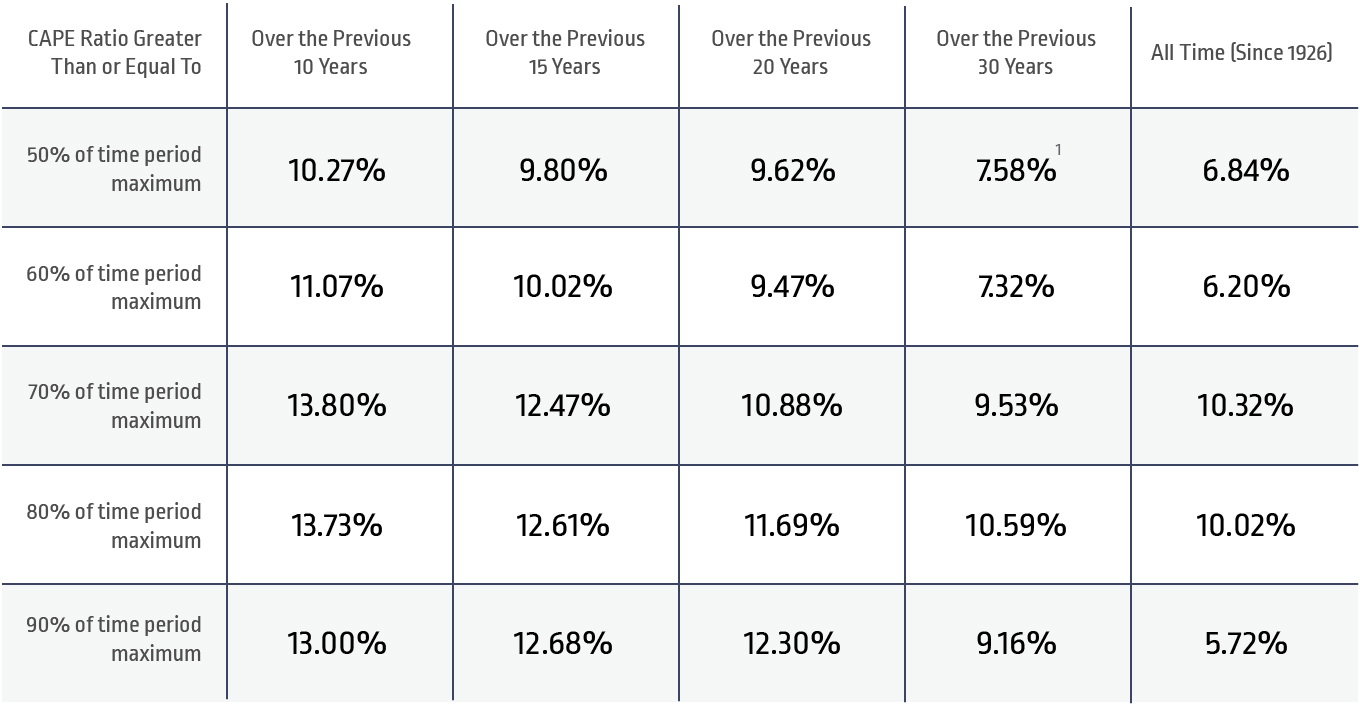
Data from 1/1926 – 12/2017. Indices are not available for direct investment. Past performance is not a guarantee of future results. CAPE ratio data from Robert Shiller. S&P 500 data from Morningstar.
I also ran the analysis using monthly numbers, and the results were similar. As a point of comparison, the average monthly return of the S&P 500 from 1926 through 2017 was 0.95%.
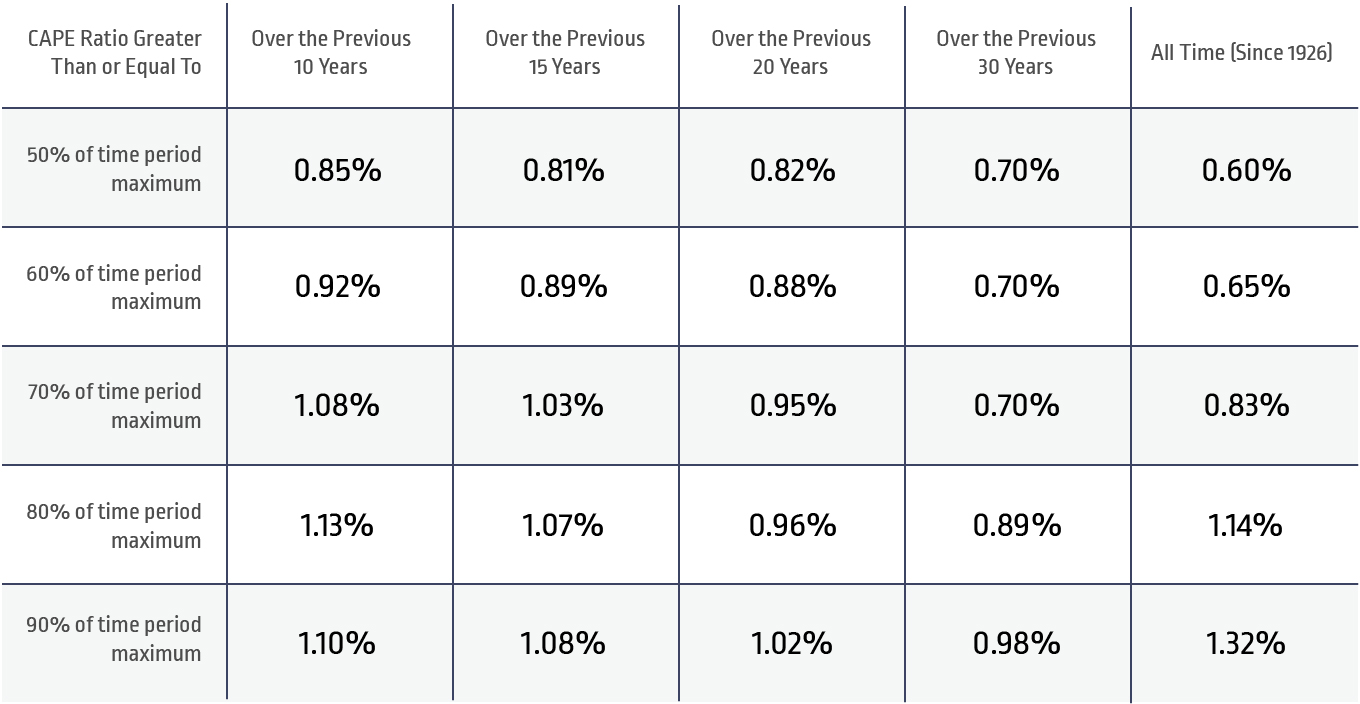
Data from 1/1926 – 12/2017. Indices are not available for direct investment. Past performance is not a guarantee of future results. CAPE ratio data from Robert Shiller. S&P 500 data from Morningstar.
While there is some variance, there are only two values that were statistically significant (2) – the subsequent annual returns when the CAPE ratio was greater than or equal to 50% of the maximum All Time period, and the subsequent annual returns when the CAPE ratio was greater than or equal to 60% of the maximum All Time period.
While this looks promising, it’s worth considering the possibility that these might be false positives. Since I ran 50 tests, I would expect, just by chance, to find two and a half results show up as significant. This does not necessarily mean that there’s nothing here, but it means that we need to be careful.
Logically, if there were a relationship here that we could exploit, would these be the data points that we would expect to find the relationship on? Or would we have expected to see more of an observable effect when the CAPE ratio was higher compared to the previous values?
Long-Term Predictability Does Not Mean Short-Term Advantage
It’s worth generalizing this point. Jim Davis of Dimensional Fund Advisors conducted a really interesting experiment. His study focused on how well investors can predict short-term returns, given that they can predict long-term returns with differing levels of precision.
In other words, he assumes that there are certain investors who can predict either five or ten year returns with different levels of accuracy. He doesn’t worry about why; he just takes it as a given. These investors then decide how to invest their portfolios each year – if they think that stocks will beat bonds, they will be 100% in stocks, and if they think bonds will beat stocks, they will be 100% in bonds.
When he runs the analysis, we can see just how difficult it is to turn long-term predictability into short-term trading advantages. He asks what percentage of investors, at each level of predictive power (3), beat a simple buy and hold, 100% stock portfolio. The results are pretty surprising.
For an investor who could perfectly predict the ten year return, they only beat the buy and hold strategy 55% of the time. You would need a predictive power of 80% to have a 50-50 shot of beating the market (it’s technically 49%, but I’ll round up). Long-term predictability does not imply a short-term trading advantage.
Davis goes on to helpfully point out that the predictive power of the CAPE ratio over ten years is 32%, which means that it would help you beat a buy and hold strategy about 20% of the time. Put another way, trying to use the CAPE ratio to predict what your portfolio should look like next year means that you’ll lose to the market about 80% of the time.
Now let’s think through the logic of what’s going on here. One of the big reasons that I’m skeptical of arguments that market valuations show that market markets are overvalued and “due” for a correction (or vice versa) is simply that the markets are at those levels. It’s not a surprise to anyone where the CAPE ratio is. No one wakes up one morning and realizes the CAPE ratio is at 70% of it’s historical maximum (or at least, they shouldn’t). No, these types of numbers are compulsively watched – TMZ has nothing on market analysts.
This means that not only were people comfortable with the market valuations at each point in time, they actually continued to push prices up. Now, price movements aren’t just a form of Brownian motion. There is actually a reason behind each move (whether we can interpret it correctly or not). Investors continued to get new information that justified each increase in prices throughout this process. Meaning that the current levels are appropriate, given all the currently available information – including where the CAPE ratio and all of the other market valuation metrics are.
That’s the crucial point here. Where the market valuations are is information that is baked into market prices. The CAPE ratio is not this mystical thing that sits separate and apart from the rest of the market and is a silent arbiter of when the market should go up or down. It’s a piece of information, just like anything else, that gets thrown into the pot when investors are considering what they want to do.
Market Timing is Bad
We also need to think about the general issues with any forms of market timing. Everyone would love the ability to get all of the gains and avoid the market’s losses. The problem is, it just doesn’t work. There are two big issues that I want to specifically call out here:
1. To time the market successfully, you need to be right twice. You need to know when to get out, and then when to get back in. If we had perfect knowledge of the future, this wouldn’t be a problem, but since we (very much) don’t, this means we have twice the chance to screw up than most people expect.
2. Markets go up more than they go down. This means that by trying to avoid losses, you set yourself up to miss potential gains as well.
Market valuations can have a lot of value, but the way they are typically used just doesn’t take that value into consideration. Market valuations are things that can be used from a strategic standpoint to help you design your appropriate asset allocation, but most investors who use them insist on trying to use them tactically. As we’ve seen time and time again, this simply does not work.


