Interest rates are one of the key tools that the Federal Reserve has to manage the economy. Changing how much it costs to borrow money (even if the Federal Reserve doesn’t have complete control of this) can slow down an overheating economy or give a slower economy the nudge that it might need. Recently the Fed has announced that they will be keeping the federal funds rate at 0 (or very near 0) until at least the end of 2023. Not to put too fine of a point on it, but this is the rough equivalent of the Federal Reserve standing on the gas pedal. They have made a public commitment, with specific criteria for raising rates, so unless something massive happens, interest rates will continue to be incredibly low for the foreseeable future.
While this might be a great time to refinance your mortgage, what do these low interest rates mean for the stock market?
Previously we’ve looked at what changes in the federal funds rate mean for stock returns. In short, the market reacts pretty strongly when the federal funds rate changes, though you can’t really trade on this effect. That’s not really what’s happening now. The Federal Reserve is saying that they won’t change rates. So what we want to be looking at is how the level of interest rates – specifically the federal funds rate – affects the stock market – both in terms of raw returns, as well as the effect on risk premia.
But before we dive into the data, let’s think about the composition of returns, and pull them apart a bit. This will help us understand what effects we should expect interest rates to have on stock returns.
The Composition of Returns
There are all sorts of different ways to cut up stock returns, but one of the most useful ways is to look at the risky and risk free portions of the return separately. This is actually the start of pretty much every asset pricing model out there (as well as being the base for how we come up with the return assumptions we use for financial planning). Whether you’re looking at the Capital Asset Pricing Model, the Three Factor Model, or something else, their general form is consistent: the expected return of a portfolio is equal to the risk free return, plus an expected return from the amount of risk that the portfolio is taking.
For this analysis, I want to be specific about how we are going to approach the risky portion of the returns. We’ll be looking at things through the framework of the Three Factor Model. As you probably gathered from the name, the Three Factor Model looks at three different factors that make up the risky portion of stock returns. Let’s look at the equation and break it down quickly (don’t worry, I did all of the math for you).
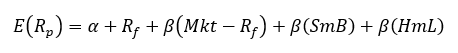
Stepping through the equation, it’s saying that the expected return of a portfolio is equal to the amount of skill that a manager is adding (this is almost always going to be zero), plus the risk free rate , plus how exposed the portfolio is to market, size, and value risk.
So how would we expect a low interest rate environment to impact these separate pieces of stock returns?
Well, the level of the federal funds rate (which influences the interest rates in the markets) is definitely going to have an impact on the risk free portion of the return, but this is a pretty small part of the total return. It’s worth pointing out that while the federal funds rate is reasonably well tied to short term interest rates, they aren’t the same thing. From September 1981 through July 2020, the correlation between the Effective Federal Funds Rate and the yield on Three Month Treasury Bills was 0.87[1]. This is certainly good enough to say that they approximate each other, but there’s enough divergence that we should be aware of it (and this divergence will be important later).
But what effect should we expect to see on the three risk factors that drive the risky portion of the return? There’s no clear link between these risk factors and the level of the federal funds rate. Before I looked at the data, I went in assuming that there would be no effect on the risk factors.
So let’s see what the data is telling us.
Relationship with the Risk Factors
A good, quick, way to see if there is a relationship between two data sets is to look at the correlation between them. If there is a relationship between them, you should see some sort of consistent correlation at play there. We might not be able to see exactly what the relationship is, but it’s a good test to see if we should dig in further. Over the period from July 1954 through July 2020, we actually have some interesting relationships to work with.
| Equity Premium | Size Premium | Value Premium | |
| Correlation with the Effective Federal Funds Rate | -0.11 | -0.03 | 0.08 |
For illustration purposes only. Effective Federal Funds Rate from FRED, Federal Reserve Bank of St Louis. Premium returns courtesy of Ken French[2]. These premiums, as well as the Effective Federal Funds Rate, are not available for direct investment.
These correlations look small, and that’s because they are, but it’s important to note that the correlation for both the equity and value premiums is statistically significant – it’s unlikely that those relationships were there by chance, at least according to the math. So we need to examine this.
When we get an unexpected result, the first thing we always check is whether it’s an artifact in the data. If we break this series up, do we see the same sorts of results? In this case, the answer is not really. If we break the time period in half (7/54 – 7/87 and 8/87 – 7/20), we don’t see the same sorts of results.
| Correlations with the Effective Federal Funds Rate | Equity Premium | Size Premium | Value Premium |
| First Half (7/54 – 7/87) | -0.16 | -0.02 | 0.05 |
| Second Half (8/87 – 7/20) | -0.05 | -0.08 | 0.06 |
For illustration purposes only. These premiums, as well as the Effective Federal Funds Rate, are not available for direct investment.
In the first half, the correlation between the Effective Federal Funds Rate and the value premium wasn’t significant anymore, but the correlation with the equity premium was actually even less likely to be random chance than it was in the first period (which should make you slightly raise an eyebrow).
But the second half of the period is where it breaks down. The correlations between the effective federal funds rate and both the value and equity premiums were not significant. However, the correlation with the size premium was significant. In other words, it’s a bit of a mess. That’s not always insurmountable, but without a good theoretical basis for why we should expect to see a relationship it makes me suspect that this is just a time period effect, and there is no real relationship between the risk premiums we’re looking at here and the Effective Federal Funds Rate.
So what about the risk free portion of the return?
Federal Funds Rate and the Risk Free Rate
As we mentioned earlier, the effective federal funds rate is not exactly the same thing as we normally work with as the risk free rate[3]. And it’s also not (exactly) the same as what the Federal Reserve announces the federal funds rate will be. When the Federal Reserve makes an announcement, they are announcing their target for what they want the federal funds rate to be. The effective federal funds rate is the rate that gets set in the market, and actually used[4]. The targets set by the Federal Reserve and the effective rate are usually very close (we’d have a really big problem if they weren’t), but it’s important to recognize that there is a difference.
So with that, let’s take a look at the correlation between the effective federal funds rate and the CRSP 1-10 Index (the best representation of the US stock market available). Over our normal period July 1954 through July 2020, the correlation was -0.05.
That’s… underwhelming. And the sign is even going in the wrong way. We would at least expect a positive correlation, meaning that as the effective federal funds rate increased stock returns tended to increase as well. But this correlation wasn’t statistically significant, so it’s really just another way of saying that what we’re seeing is random noise. The problem is that between the effects of the differences between the federal funds rate and the risk free rate, and the (much more important) effect of the risky portion of the return swamping the results, we can’t really see any sort of effect.
So let’s look at this in a different way. Let’s look at the returns in those months where the effective federal funds rate was above average, compared to when it was below average. If things are working like we expect, we would expect returns to be (slightly) higher in those months when the effective federal funds rate was above average, and lower when it was below average. And that’s exactly what we see.
| When the Effective Federal Funds Rate is: | Number of Months | Average Monthly Return of the CRSP 1-10 Index |
| Above Average Yield (>4.74%) | 373 | 0.98% |
| Below Average Yield (>4.74%) | 420 | 0.92% |
Data from July 1954 through July 2020. For illustration purposes only. CRSP 1-10 Index from Morningstar. Indices, as well as the Effective Federal Funds Rate, are not available for direct investment.
We don’t see a huge premium, but we shouldn’t have expected to see one. The risk free return isn’t a big driver of returns, so we shouldn’t expect to see a big result. And if we use the median yield of the effective federal funds rate (4.42%), we see basically the same result.
But something really interesting starts happening as soon as we start moving away from the center of the distribution – even a little bit. The relationship flips.
| When the Effective Federal Funds Rate is: | Number of Months | Average Monthly Return of the CRSP 1-10 Index | |
| 25th Percentile | Above 25th Percentile Yield (>4.74%) | 595 | 0.88% |
| 25th Percentile | Below 25th Percentile Yield (>4.74%) | 198 | 1.15% |
| 50th Percentile (Median) | Above 50th Percentile Yield (>4.42%) | 373 | 0.96% |
| 50th Percentile (Median) | Below 50th Percentile Yield (>4.42%) | 420 | 0.93% |
| 75th Percentile | Above 75th Percentile Yield (>6.51%) | 199 | 0.58% |
| 75th Percentile | Below 75th Percentile Yield (>6.51%) | 594 | 1.07% |
Data from July 1954 through July 2020. For illustration purposes only. CRSP 1-10 Index from Morningstar. Indices, as well as the Effective Federal Funds Rate, are not available for direct investment.
So, what’s going on here? Well, the first thing to point out is that we don’t see this sort of relationship when we are looking at how we actually measure the risk free rate[5]. That relationship is pretty well behaved.
The issue is that the federal funds rate is indicative of what the Federal Reserve is trying to do to the economy. When the federal funds rate is low, they are actively trying to give the economy a boost, and when rates are high, they are trying to slow it down a little bit. While the stock market and the broader economy are not the same thing, they are pretty tightly tied (at least over the long term). That means that when the Federal Reserve starts pushing on the economy, by making borrowing easier or harder (along with the other tools at their disposal), they are going to have an effect on the stock market.
The market knows this. But the market reacts to changes in the federal funds rate, not simply the level. When there is a change in the federal funds rate the market absorbs that information and adjusts accordingly. In broad strokes, when the federal funds rate drops, the markets go up, and when the federal funds rate goes up, the markets drop. This is what we are seeing when we push away from the middle of the distribution.
What do you do with this?
The obvious question to be asking here is that since we can see this relationship, can we do anything with it? Can we trade on it to beat the market? Well, no. Just like anything else, the market reacts to these changes incredibly quickly. Unless you have some way of predicting changes in the federal funds rate before the rest of the market, then the market will have already incorporated the new information before you can trade on it (just like anything else).
Overall, it does not appear that the level of the federal funds rate has a significant impact on the stock market – though changes in the federal funds rate can have a meaningful impact. When you step back, this makes complete sense. The market moves based on new information. The level of the federal funds rate staying in the same place is technically news in that it hasn’t moved, but it’s not exactly earth shattering. The market will adjust when there is some actual movement, and investors need to update their models.
In conclusion, what should you do now that the federal funds rate is likely to be incredibly low for the next few years (other than checking on a refi)? Well, not all that much in terms of your stock investments. The expected return of stocks is likely to be slightly lower than it has been historically because the low federal funds rate will likely mean we will stay in a low interest rate environment, but this will be true for all of your investments. The risk free rate will be lower for everything, so there’s no getting away from this effect. While the ratios between the expected returns of different types of investment may change slightly (and reliable income sources will likely continue to be pretty expensive), this isn’t something that should cause significant changes in most people’s portfolios. By and large, most people should simply note that expected returns will likely be a little bit lower, but simply stay the course.
[1] This period was chosen because the 3 month t-bill yield data, available from the Federal Reserve Bank of St Louis, begins 9/81.
[2] The Effective Federal Funds Rate is available at: https://fred.stlouisfed.org/series/FEDFUNDS and the Premium returns series are available at: http://mba.tuck.dartmouth.edu/pages/faculty/ken.french/data_library.html Ken French is my father..
[3] Typically, we consider either the one or three month Treasury Bill to be the risk free rate. The assumption that we are making is that the risk that the US Treasury will default in the next 3 months is vanishingly small, and that there are no other bond issuers less likely to default over that time period.
[4] The federal funds rate is used mainly by large banks loaning money to each other overnight.
[5] Typically, either the one or three month Treasury bill rate.


