Understanding the relationship between bond risk and time to maturity and duration of a bond provides the basis for understanding the bond yield curve. The yield curve shows the yields to maturity for a series of bonds — typically U.S. Treasury bonds — with the same credit quality but different maturity dates, along with the term structure for interest rates.
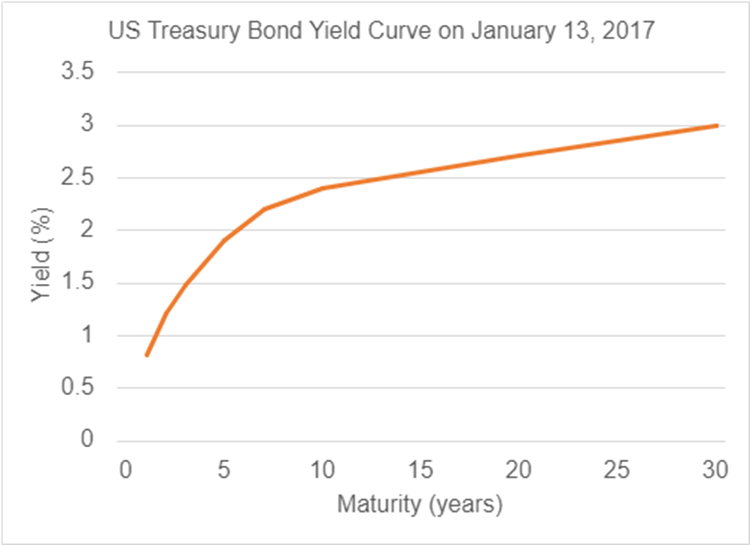
Put simply, a yield curve shows the yields to maturity for a series of bonds — typically U.S. Treasury bonds — with the same credit quality but different maturity dates, along with the term structure for interest rates. As an example, let’s look at the US Treasury yield curve as of January 13, 2017 (as an aside, when someone talks about the yield curve, it’s almost always the US Treasury yield curve).
So far the yield curve is just plotting out the yields to maturity on a bunch of bonds, which isn’t all that interesting. So why is it so important?
What Does the Yield Curve Tell Us?
The yield curve is important for what it can show us about what is going on in the market – especially around Term Risk (or maturity risk as it is sometimes known). Essentially, the yield curve is showing us how much more bond issuers have to pay to borrow money for longer (remember, bonds are just fancy loans).
This is also why everyone talks about the US Treasury yield curve as the yield curve – the US Treasury is considered to be the bond issuer with the least default risk. If we were to look at the yield curve for a specific company, or even another government, we would be mixing in the issuer’s default risk, and we wouldn’t be able to get as clear a picture of term risk, at least in aggregate.
Why Does the Yield Curve Look Like it Does?
The obvious next question is about the shape of the yield curve. Why does it look the way that it does?
Bonds that have a longer maturity – that will pay back their principal further out in the future – are riskier for you as the lender. You are locking in a specific stream of payments for the life of that bond. If interest rates change through time, and specifically if they go up, you have missed out on the opportunity to loan that money out at a higher interest rate (or do anything else with it for that matter). That money is locked up until the bond matures, and the lender is taking on all of that risk. The higher yields (or interest rates when we’re the ones borrowing money) are compensation for accepting that risk.
Think about it in terms of when you are going to a bank to get a mortgage. The interest rate on a 15 year mortgage is going to be lower than the interest rate on a 30 year mortgage. It’s (almost) exactly the same thing in the bond market.
To be precise about it the shape of the yield curve is molded by two theories. First, expectations theory suggests that the shape of the yield curve should be reflected by beliefs about future short-term interest rates. Investing in bonds over ten years can be done in two ways:
- buy a 10-year bond, or
- buy aa one-year bond and then reinvest in a new one-year bond after one year, continuing with a succession of ten one-year bonds
For markets to be in balance, these two strategies should offer the same expected return to an investor, meaning that the combined impact of one-year rates over ten years should match the rate for a ten-year bond.
Since interest rate fluctuations are extremely difficult to predict, the expectations theory alone would probably leave the average yield curve relatively flat.
The other theory to determine yield curve shape is the liquidity preference theory, which suggests a need for a risk premium to be offered for longer-term bonds to account for their increased interest rate risk and price volatility.
Longer-term bonds are less liquid, as well, since this price risk could force them to be sold at a loss if an unexpected expense arose.
With this risk premium added to the expectations theory, the typical or neutral shape for the yield curve becomes upward sloping (like in our example earlier).
And it also gets to the reason that we used an old yield curve as an example at the beginning of this article is because the current yield curve is inverted. That is, we don’t see the upward sloping curve on the yield curve.
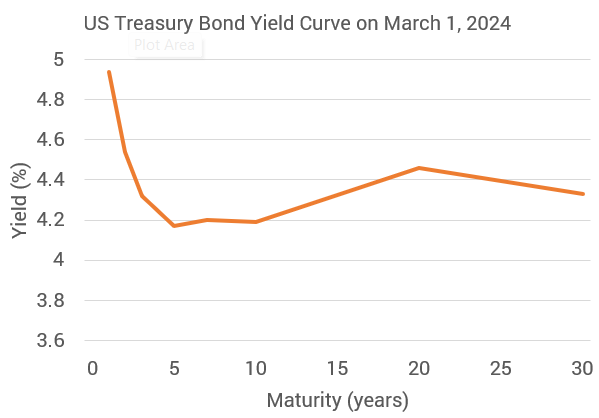
Needless to say, this yield curve is a lot less aesthetically pleasing. And more importantly, it doesn’t really line up with our expectations of how the bond market “should” work. But inverted yield curves aren’t a sign of the apocalypse either. An inverted yield curve where short-term rates exceed long-term rates can be understood as a clear expectation that short-term interest rates will fall in the future.
What Causes the Yield Curve to Move?
Now that we understand what the yield curve is, and what it is telling us, we need to think about why it might change. So what does cause the yield curve to change?
In short, everything.
The yield curve – just like everything else in the financial markets – is constantly moving. Bond yields might not move as dramatically as stock prices, but they are never sitting still. They are representative of what investors would pay for these specific bonds (if you want to get real deep in the weeds on the math, you can take a look at the Treasury Department’s Treasury Yield Curve Methodology)
And the price that an investor is willing to pay is based on effectively everything. The markets take all of the available information into account – including expectations about the future. So as conditions change, which they constantly do, the yield curve will change. And even more specifically, the yield curve will change based on whether the new information is better or worse than what was expected (and built into investor’s models).
The bond yield curve provides a reality check on retirement spending. Spending beyond what the bond yield curve can support introduces the risk that future spending will need to be cut if higher returns are not realized.