It’s pretty easy to make finance stuff sounds scary. What happens in the financial markets has a direct effect on our retirement – but those same financial markets are basically a black box for most people (and a very dark gray box for a lot more). So it’s very easy for the financial media to portray pretty much anything in an extreme fashion. Everything is always going to be the end of the world, or the best thing ever – so you better click on this link, or watch this video. The truth is, most of the time most things aren’t momentous events.
A good example of this is the current hullaballoo around the inverted yield curve.
What is an Inverted Yield Curve?
A good place to start is by talking about an inverted yield curve. And an even better place to start is by talking about what the yield curve is. Essentially, the yield curve is just the yield to maturity on the bonds of a single issuer. And when people talk about the yield curve, they are almost always referring to the yield curve on US Treasury bonds. It’s almost trivially simple (it’s literally just a list of the yields on a bunch of bonds), but it gives us a ton of information on what’s going on in the bond markets and with bond returns. This information is useful for both describing what is currently happening, and also what might happen out into the future. And both of these will come into play with inverted yield curves.
Normally, yield curves have an upward slope. The yield on a longer term bond “should” be higher than the yield on a shorter term bond. Think about mortgages – the bank will give you a lower interest rate on a 15 year mortgage than it will on a 30 year mortgage. It’s basically the same principal here. The lender (in the case of bonds, you) are locking up your money for a longer period, so you demand a higher return to lend them money. Normally, we say that longer bonds carry more Term Risk.
But when the yield curve is inverted it’s (sort of) upside down. We don’t see that normal upward slope. We see the opposite. For some reason short term bonds have a higher yield to maturity than longer term bonds do. This isn’t something that is super common, but it’s also not unheard of either.
Before we think about why this is happening, or what it means, let’s take a look at the actual curve so we can see what we’re talking about.
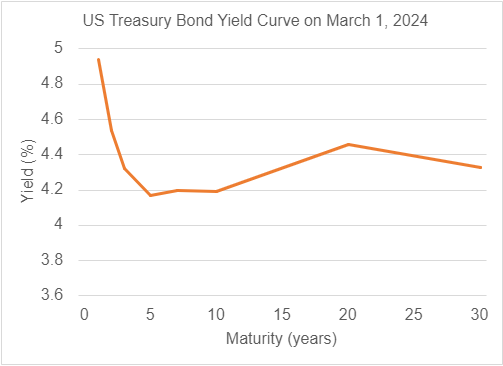
As we can see, short term Treasury bond rates are pretty high, but then they come down and are relatively flat going forward.
Why is the Yield Curve Inverted?
There are all sorts of stories about what’s going on here, but they usually are focused on the Federal Reserve propping up shorter term interest rates.
But one aspect that isn’t being talked about as much is how investor’s expectations about the future are impacting the yield curve now.
To figure out what an inverted yield curve means, we can actually think of longer-term bonds as a series of short-term bonds stacked on top of each other. So, let’s say that we’re looking at a 5 year bond. We can envision that as a series of five 1 year bonds that each start one after the other (or any other set of bonds that adds up to five years.) This matters because it allows us to use the yield curve to estimate what the market is estimating rates will look like between any two points.
For markets to be in balance, assuming interest rates stay the same, these approaches should be exactly equivalent strategies. But that qualifier – that interest rates will stay the same – is a doozy. It never actually holds true (the markets are always moving), but the way it breaks down tells us a lot about what is going on.
In the case of an inverted yield curve what we see is that investors expect short term rates to come down in the near(ish) future.
What does the Inverted Yield Curve Mean for Markets?
Anytime we see an inverted yield curve we get a ton of gloom and doom stories from the media. They’ll talk about how an inverted yield curve has “predicted” every recession since 1970. But they won’t talk about how we’ve had inverted yield curves that haven’t “predicted” recessions. They’ll say that an inverted yield curve means that we’ll have a recession in 12 months. But they won’t really talk about how as of spring 2024 we’re closing in on the yield curve being inverted for close to two years already. It’s always important to remember the old cliché about economists predicting 8 of the last 5 recessions.
But if it doesn’t mean the end of the financial world, what does it mean?
At a practical level, now is probably not a great time to go load up on long term bonds, or take out a short term loan if you’re flexible on your timing. But it doesn’t mean that the markets are going to fall apart.
Beyond that it’s unclear (like pretty much every “indicator”).
Trying to predict what markets are going to do next is hard. Even professional money managers can’t beat the market. And that’s because the markets already incorporate all of the available information – including that the yield curve is inverted, and all of the gloom and doom sentiment that comes with that. What causes the markets to move is what happens next, and more specifically if what happens next is better or worse than what was expected.
Presuming that you have built a well-diversified portfolio that is designed around your risk tolerance and retirement income needs, you probably don’t want to make any changes to your portfolio based on what the yield curve happens to do.


