The primary subject of my book is comparing the risk premium with risk pooling as a source of funding for retirement goals. An important step is to first make clear what the risk premium is and how it relates to an investment portfolio. Fundamentally, investors prefer certainty to uncertainty. A bond provides a known yield with contractual protections helping to ensure that its return is realized if held to maturity. Stock returns are more uncertain, as they depend on the future performance of the company as well as on changing investor perceptions about the company.
If a stock offered the same average return as bonds, but with greater volatility around that average, the typical risk averse investor would not be willing to purchase it. Risk averse individuals are willing to pay more to receive certainty, so less-volatile assets should have lower expected returns. To accept risk, investors will seek a higher expected return over time than they could receive from more reliable bonds. That higher expected return represents the risk premium. Stocks can generally be expected to outperform bonds over time, but such outperformance is not predictable and there can be reasonably long stretches in which stock returns lag bonds.
A good starting point for understanding the historical returns for different asset classes is with Morningstar and Ibbotson Associates data. They have compiled US financial market returns since 1926 in their SBBI (Stocks, Bonds, Bills, and Inflation) Yearbook. This data is usually the source for calculating average historical market performance and creating assumptions for future portfolio returns. We can use this data as a starting point for understanding about historical stock performance.
Exhibit 1.1 provides historical averages and volatility for different market indices in this dataset for both nominal and real terms. With this dataset, small-capitalization stocks have offered the most return potential along with the most volatility. Their simple average arithmetic return was 16.2 percent during this time period in nominal terms, with a standard deviation of 31.6 percent.
Arithmetic mean returns are calculated by adding up all the annual returns from the historical data and then dividing by the number of years in the data set. The standard deviation is a measure of volatility in terms of the degree of fluctuations experienced around the average outcome. Approximately, two-thirds of the historical returns fell within the range of 31.6 percent more or less than the average of 16.2 percent. That range is -15.4 percent to 47.8 percent. The remaining one-third of historical returns were even more extreme in either direction. Volatility reduces the predictability for realized returns. When thinking of risk as volatility, we generally care most about the risk for losses, but if market returns are symmetric around an average, then using standard deviation will work just as well.
While the arithmetic mean represents the average historical growth rate over a single year, it does not reflect the growth rate over a longer period. The average compounded return represents the growth rate over multiple years, and it is always less than the arithmetic mean for any volatile asset. Increased asset volatility causes the compounded return to fall by even more relative to the arithmetic return. For long-term investors, it is the compounded return that matters.
To understand this volatility effect on compounded returns, realize that positive and negative returns do not create a symmetric impact on wealth. Negative returns must be followed by even larger positive returns to get back to the initial point. For instance, a 50 percent drop requires a 100 percent gain to get back to the starting point. For this reason, wealth will grow at a lower compounded rate than the arithmetic average. Compounded returns take a larger haircut as the volatility of returns increases. With the high volatility of small-capitalization stocks, the compounded return was 11.8 percent, a full 4.2 percent less than the arithmetic average. The 11.8 percent return reflects the fixed growth rate for the asset class that supported its cumulative return over the entire historical period.
Next in the chart are large-capitalization US stocks, as represented by the S&P 500 index since its creation in the 1950s, and a more general index of large companies in the years before that. The arithmetic average for large-capitalization stocks was 11.9 percent (roughly 12 percent, which is why that number is used on occasion as an estimate for stocks returns) with a standard deviation of 19.8 percent (roughly 20 percent). The volatility impact was such that these stocks grew over time at an average compounded rate of 10 percent.
Exhibit 1.1 Summary Statistics for US Financial Market Annual Returns and Inflation, 1926–2018
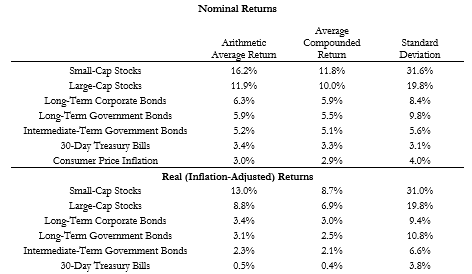
Source: Own calculations from SBBI Yearbook data available from Morningstar and Ibbotson Associates.

This is an excerpt from Wade Pfau’s book, Safety-First Retirement Planning: An Integrated Approach for a Worry-Free Retirement. (The Retirement Researcher’s Guide Series), available now on Amazon.


