This article is part of a series; click here to read Part One.
Moving to bonds, Morningstar data shows that since 1926, the average return from intermediate-term government bonds was 5.2 percent with a standard deviation of 5.6 percent. With the lower volatility, the compounded return is only slightly less at 5.1 percent. For long-term government bonds, annual returns averaged 5.9 percent with volatility of 9.8 percent, and long-term corporate bonds averaged 6.3 percent with volatility of 8.4 percent. The observation that corporate bonds enjoyed higher returns than long-term government bonds with less volatility is an anomaly about the usual link between risk and reward. But these are after-the-fact numbers and may not reflect investor attitudes about risk. Corporate bonds are usually considered to be riskier than government bonds due to their credit risk regarding potential defaults. Meanwhile, thirty-day Treasury bills averaged 3.4 percent with volatility of 3.1 percent. These different bond asset classes have varying return and volatility characteristics.
Among the universe of bond fund choices, retirement income studies generally show the most favorable results with intermediate-term government bonds. They provide an appropriate balance between seeking higher yields while also maintaining lower volatility to avoid jeopardizing the spending goals for the portfolio. Including more types of bonds, such as corporate bonds, long-term bonds, or short-term bills, can be justifiable for reasons other than maximizing the sustainable spending rate from a portfolio.
Exhibit 1.1 Summary Statistics for US Financial Market Annual Returns and Inflation, 1926–2018
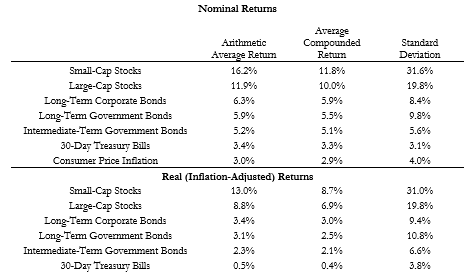
Source: Own calculations from SBBI Yearbook data available from Morningstar and Ibbotson Associates.
The chart also shows that inflation historically averaged 3 percent with a 4 percent standard deviation. With the low volatility, the compounded inflation rate was only slightly less at 2.9 percent. This leads us into the second part of Exhibit 1.1, providing the real historical returns after removing inflation. Real returns put the analysis on a consistent basis over time so that the long-run spending plans may be discussed in terms of today’s purchasing power. Focusing on two of the asset classes in the table that are most relevant to our subsequent discussion, if we remove the effects of inflation from the compounded returns, historically the S&P 500 provided an inflation-adjusted compounded return of 6.9 percent, and it was 2.1 percent for intermediate-term government bonds. The respective arithmetic real returns were 8.8 percent and 2.3 percent.

This is an excerpt from Wade Pfau’s book, Safety-First Retirement Planning: An Integrated Approach for a Worry-Free Retirement. (The Retirement Researcher’s Guide Series), available now on Amazon.


