The most fundamental question of retirement planning has nothing to do with investments, or tax rates, or any of the “stereotypical” topics of financial planning. The question we really want to know the answer to is how long of a retirement we need to plan for (which is the delicate way of asking how long we’ll live for.)
Knowing how long of a retirement to plan for means that you can target everything much more specifically, and make sure you get the full use out of all of the money that you saved throughout your life. When there is uncertainty about your “planning horizon” you need to build in a cushion for the chance that you will live longer than expected.
Unfortunately, at least from a planning perspective, we can’t predict how long we’ll live with any degree of specificity. But that doesn’t mean we’re flying blind. There are a few things that we can look to for guidance on how long our retirement assets need to last.
What is Your Life Expectancy?
We can start by looking at our life expectancy. Life expectancy is the expected age that the someone who is part of the group described by the life expectancy will pass away. Both parts of that explanation are important.
The first part, the expected age, means that a life expectancy number is an average of when people pass away. It is (very roughly) the point where you have a 50% chance of either passing away before that age, or outliving that age. It can give you a sense of where the ballpark is, but you’ve got, absent any other information, a 50/50 shot of living beyond the life expectancy. From a planning perspective, you are likely going to want to plan on a longer retirement.
The second part, that a life expectancy describes a specific population, is incredibly important. We often see reports in the media about life expectancy in the US (as of 2022, it was 74.8 years for men and 80.2 years for women,) but aside from giving us an overall snapshot of the health of the country, it’s not that useful for planning purposes. Luckily for us, the CDC has run the numbers in all sorts of different ways for us.
One of the most useful ways to look at the numbers is to focus on your life expectancy after a certain age. Essentially, given that you’ve reached a certain age, how many more years are you likely to live?
The CDC gives us these numbers, all the way from 0 to 100 (though we can just look at the ages around retirement) for 2022.
| Total | Male | Female | |
| 55 | 26.7 | 25.0 | 28.4 |
| 60 | 22.7 | 21.1 | 24.2 |
| 65 | 18.9 | 17.5 | 20.2 |
| 70 | 15.3 | 14.2 | 16.3 |
| 75 | 12 | 11 | 12.8 |
| 80 | 8.9 | 8.1 | 9.5 |
| 85 | 6.4 | 5.8 | 6.8 |
| 90 | 4.4 | 3.9 | 4.6 |
| 95 | 3 | 2.7 | 3.1 |
| 100 | 2.1 | 1.9 | 2.2 |
But we can also frame it a different way. Given that you are currently 65 years old, how likely is it that you will live to a certain age?
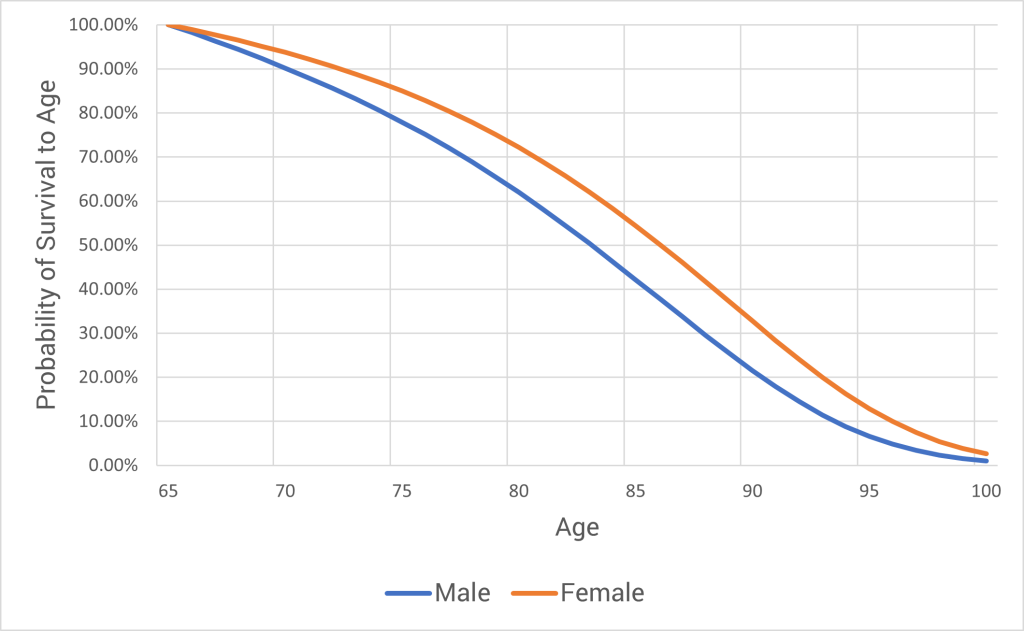
As we can see from this chart, men have a 50% chance of living to age 83, and women have that same 50% chance of living to age 86. And if we look at the far end of the spectrum, a 65 year old woman is 2.7 times more likely than a 65 year old man of living to 100.
We’re Living Longer Than (Almost) Ever
And it’s worth noting that our life expectancy has increased through time. Again, if we focus in on your life expectancy at age 65, we can actually see how much healthier (or at least long lived) we have gotten over the years.
| Year | Male Life Expectancy at 65 | Female Life Expectancy at 65 |
| 1950 | 77.8 | 80 |
| 1960 | 77.8 | 80.8 |
| 1970 | 78.1 | 82 |
| 1980 | 79.1 | 83.3 |
| 1990 | 80.1 | 83.9 |
| 2000 | 81 | 84 |
| 2010 | 82.7 | 85.3 |
| 2020 | 82 | 84.8 |
| 2022 | 82.5 | 85.2 |
Aside from the 2020 data point, which is driven by the COVID-19 Pandemic (and which seems to be rapidly correcting itself), there is a very clear trend in this data. Over time, we have all been living longer. And it is likely that this will continue as medical care continues to improve.
How Healthy Are You?
In addition to the general population numbers, you want to consider your own health. The life expectancy numbers we’ve looked at are broad averages based on the broad distribution of people (if you want to go spelunking through the data, the CDC has the data broken down by not only gender, but also ethnicity – we’re just looking at the total US numbers here though). And that’s really useful when we’re talking about big groups in aggregate.
But you aren’t a distribution. You will pass away at a specific point in time. And that could be significantly after (or before) your life expectancy.
There are never any guarantees, but it is helpful to consider your family history. Did Willard Scott wish all of your grandparents a happy 100th birthday? If so, you might want to plan on a longer retirement than the overall averages suggest. On the other hand, if your family members have passed away on the earlier side, you might be closer to the average. Though I would be cautious about betting on a shorter life expectancy. Not only has medical care gotten really good, you also need to factor in how much medical care will improve out into the future.
You also want to think about the state of your personal health. Simply put, the healthier you are overall, the longer you are likely to live. If you just finished your 3rd marathon of the year you’re probably going to be around for a while.
What About Your Spouse?
For those of us who are married (or retiring with our partner), we also need to consider their life expectancy. And that brings in a whole new layer of complexity.
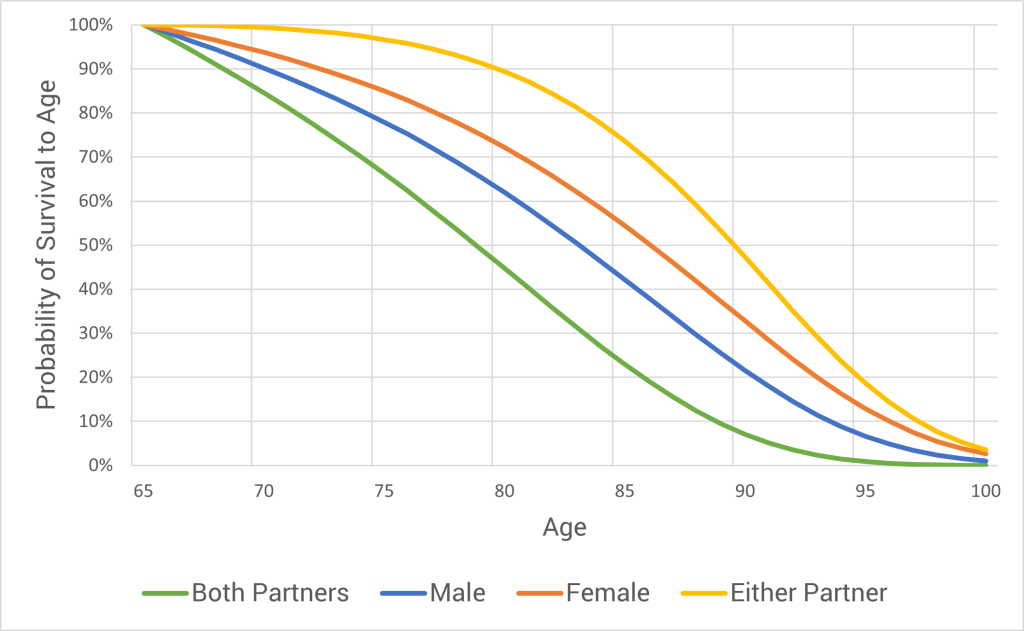
To put this in perspective, for heterosexual couples, assuming that you are both currently 65, there is about a 50% chance that one of you will reach age 90 (though unfortunately there’s only a 7% chance that both of you will reach 90). And same sex couples are in the same ballpark – if both partners are men, there is a 50% chance that one of you will reach 88, and if both partners are women, there is a nearly 50% chance that one of you will reach 91. As we’ve seen earlier, women tend to live longer than men, and this is only accentuated when both partners are women.
Focusing back on the heterosexual couple, we can look at what the joint survival probabilities look like through time.
Incorporating Life Expectancy Into Your Planning
How long you (and your spouse) will live is one of, if not the, most important variable in your retirement plan. Many people dream of bouncing their last check, but that is a risky strategy without knowing exactly when that will be. And (fortunately or unfortunately) we simply can’t know when we will pass.
But with the data we have been examining, we can get a rough sense of how long of a retirement that we might want to plan for.
While it might be tempting to target the average life expectancy (with adjustments for your family history), you may want to plan on a living even longer. Simply put, you don’t want to run out of money. If you build your plan assuming that you will live until you are 86, but you live until you are 106, those last 20 years that you didn’t plan for might be a little tight.
On the other hand, it probably doesn’t make sense to plan on living until you’re 125 years old either. It’s exceedingly unlikely that you will live that long as the oldest person to ever live “only” lived until she was 122 years old. By assuming a shorter retirement you could have spent more each year (if you wanted to).
To manage this uncertainty it can help to examine your retirement plan using multiple different assumptions. How does you plan look if you assume that you(and your spouse if applicable) will live until your life expectancy? What if you live 5 years longer? 10 years longer? Are you comfortable with those scenarios?
Like most things with retirement planning, there are no definitive answers. However, considering these different scenarios can give you crucial information about how you should structure your retirement plan.