There will always be some asset class that does poorly. Over the last few years, one of those asset classes has been international stocks. They have underperformed US stocks each of the previous three years, and it’s looking like they’ll do it again this year. Given this underperformance, we’ve had some people ask why we keep them in the portfolio.
Let’s look at this in three ways:
- We want to be fully diversified
- Recent performance
- what is likely to happen in the future
It is a Global Stock Market
We’ll start with the big picture. We design our portfolios to harvest market returns. Time and time again, we have seen that it is impossible to consistently guess what the markets will do in the future, but that folks who own the market and stay disciplined end up doing pretty well for themselves. “Own the market” means staying invested in international stocks.
As of the end of 2023, the US represented roughly 60% of the value of the world’s stock markets. So about 40% of the global stock market’s value was not in the US. In other words, if we were to exclude international stocks, we would be losing a pretty massive chunk of the world market.
It’s important to remember just how interconnected the world economy is now. If you walk into any big box store, most of the stuff you see on the shelves was manufactured somewhere other than the US. You can argue about whether that is a good or bad thing, but it means that the world is tightly tied together. Global shipping routes give us a clear picture of that.
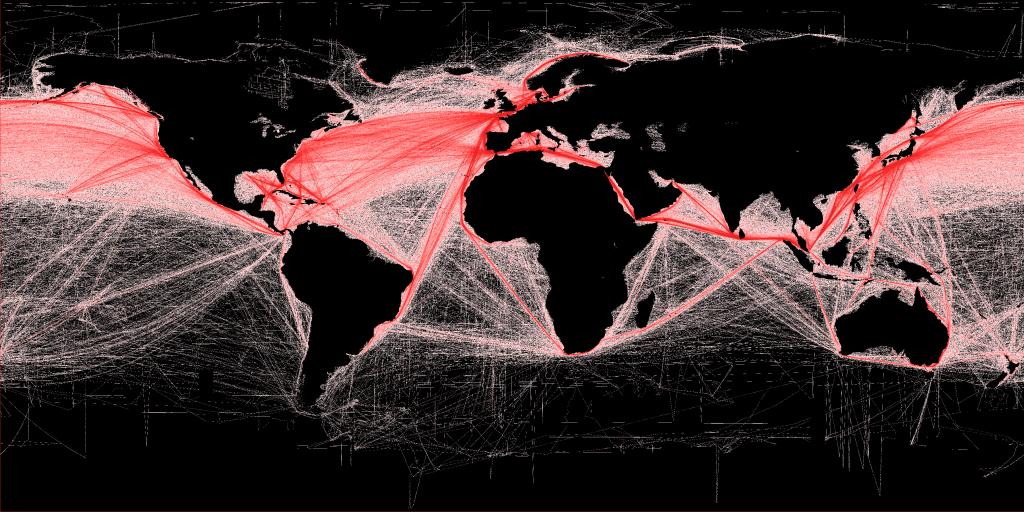
B.S. Halpern (T. Hengl; D. Groll) / Wikimedia Commons / CC BY-SA 3.0
The world economy is no longer in neat little boxes where you can safely ignore what is happening on the other side of the globe. I think of it a little bit like industries. The manufacturing industry in the US looks very different from the technology industry or the financial services industry, but I want them all in my portfolio so I can capture market returns. The only way to do this is to own everything.
Just from a pure diversification stand point, we don’t want to exclude international stocks. We want to own as many securities as possible in order to eliminate the risks the market doesn’t compensate us for.
International stocks are actually excellent diversifiers. If we look at the historical data, US and international stocks move pretty differently from each other. The correlation (a statistical measure of how similar the movement of two series are) between the S&P 500 Index (US stocks) and the MSCI World ex US Index from January 1970 to December 2023 was only 0.69.
To put that in perspective, over the same time period, the correlation between the S&P 500 Index and the CRSP 9-10 Index (which represents the microcap portion of the US market) was 0.76. In other words, they are still stocks, but the US and International markets move reasonably differently through time (and we’re certainly seeing that now).
What’s Been Happening
| Annualized Return | Standard Deviation | |
| S&P 500 Index | 10.70% | 15.41% |
| MSCI World ex US Index | 8.88% | 14.95% |
Now, at first glance, this doesn’t look so good for my contention that there is no expected return difference between US and international stocks. But the key thing to notice here is the standard deviations—they’re pretty massive numbers, which means these things are all over the place. So much so that there is no reliable statistical difference between the returns.
There’s a very good chance that the difference is purely random noise. We have over forty-five years of data, and we can’t reliably say that either the US or international stocks tend to outperform the other.
We can also see this if we simply look at how often international stocks outperform US stocks, and vice versa.
| Monthly | Annual | |
| S&P 500 Index Wins | 51% | 54% |
| MSCI EAFE Index Wins | 49% | 46% |
It’s a coin flip whether US stocks will beat international stocks or international stocks will beat US stocks.
Let’s think about coin flips for a second. You’re equally likely to get heads or tails, and each flip is independent. If you got heads last time, that doesn’t mean anything for the next flip—you still have a 50% chance of getting either heads or tails.
Let’s say we filled all 68,576 seat of Gillette Stadium with folks flipping coins (we couldn’t afford to rent out Michigan Stadium with its 107,601 seats). And let’s say that we’re trying to find the best coin flipper. We’re going to have everyone flip their coins, and anyone who gets tails loses. It would take about 16 coin flips for us to expect to get a winner.
Now, that last person left is not actually the best coin flipper. They just got incredibly lucky. And it’s the same story with the returns of US and International stocks. Since which will do better is random, we expect to see a whole bunch of streaks—and big streaks every once in a while.
Looking at the historical data, we see those streaks pretty clearly. Using annual returns from 1970 on (which was the start of the MSCI World ex US Index), there are some pretty big streaks. The longest that the US has outperformed international stocks in a row is four years, which has happened four times, most recently from 2018-2021.
On the other hand, we’ve had two periods where international stocks have outperformed US stocks six years in a row—1983-1988 and 2002-2007. It’s interesting to note that these six streaks represent two thirds of the total time period (36 of the 54 years we have data for).
Right now, we’re in between streaks. In 2022 international stocks outperformed, and in 2023 US stocks outperformed. But, as we can see, these streaks happen.
Will US Stocks Do Better than International Stocks in the Future?
All of this stuff is interesting, but the real question is what’s going to happen going forward, and what we should do about. Essentially, we want to know if US stocks are going to keep outperforming international stocks – and if so, do international stocks have a place in your portfolio?
An investment’s expected return is based on it’s level of risk. You can’t have higher expected returns without a commensurate higher level of risk (we can talk about what risk means in your broader retirement plan, but in this context it’s investment risk). So, if we think that a set of stocks (US Stocks) is likely to have higher returns in the future than another group (international stocks), we need to think about why that is.
Well, the big question is do companies that are headquartered outside the US have a different level of risk than companies headquartered inside the US? And more specifically, does the fact that a company based in Paris, France mean that it is less risky than a company based in Paris, Texas.
It’s hard to see how – especially when we are thinking about it from the perspective of the market (aka the average investor). We, as retirement focused investors in the US, may care about foreign currency risk and some of the complexities that come from international investing, but the average investor who isn’t tied to a specific place, doesn’t.
In fact, there’s a five step test that we use to test whether a return difference is actually something that is likely to persist. And the first test is whether the return difference makes sense. Basically, what’s the risk story?
With this, there really isn’t a real risk story – I’m not aware of any real reason there should be any substantive difference in risk between US and international stocks.
So we come back to where we started—wanting to harvest long-term market returns. And the way to do that is to stay diversified and disciplined. We wouldn’t drop energy stocks from our portfolio if they have a bad couple of years, so we don’t want to drop international stocks from our portfolio after a bad couple of years either.


