This article is part of a series; click here to read Part 1.
Using the portfolio return and volatility assumptions determined in Exhibit 1.1, we then reverse engineer fixed return assumptions and sustainable spending levels for a desired retirement time horizon and targeted probability of success. The investment portfolio is modeled using 100,000 Monte Carlo simulations for these portfolio returns, assuming a lognormal distribution.
Exhibit 1.2 presents the implied compounded real returns for different planning horizons and probabilities of success. As these are real return factors, they would support inflation adjusted spending. The arithmetic average portfolio return is 4 percent real with a standard deviation of 10 percent. However, for deciding on a fixed return assumption, one must account for the likelihood of success they seek for the spending plan in terms of both a planning horizon and probability of success. For instance, if the retiree sought a 90 percent chance that portfolio distributions could be sustained through age ninety, this would imply an assumed fixed real growth rate for the portfolio from the 10th percentile of outcomes at 0.5 percent.
Exhibit 1.2 Fixed Rates of Return Assumptions for a Sixty-Five-Year-Old Reverse Engineered Inflation-Adjusted Compounded Returns for Retirement
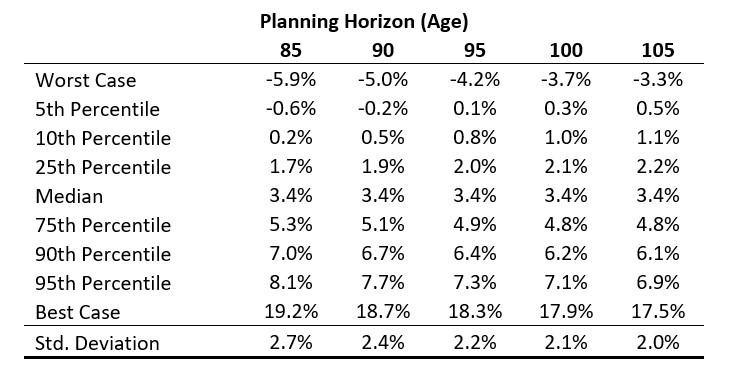
Source: Own calculations with 100,000 Monte Carlo Simulations for a 50/50 portfolio of stocks and bonds. These calculations are based on the net portfolio returns shown in Exhibit 3.11. The portfolio’s real arithmetic return is 4% and standard deviation is 10%.
We should make a few observations about this 0.5 percent return value. First, it is less than the assumed 1 percent real return from holding bonds. In other words, to achieve the desired success rate from the diversified portfolio, one ends up assuming a lower return, and therefore a lower spending amount, than bonds could ensure. The flip side of this, though, is that 90 percent of the time the retiree could expect to earn a higher effective return than this number and may even be able to grow their wealth throughout retirement as they otherwise are spending less than would have been feasible. Conversely, the bond ladder would lock-in the 1 percent real return throughout retirement without a chance for upside.
The other interesting aspect is to note that the fixed return assumption increases for longer retirement horizons, as it is 0.8 percent for planning through age ninety-five and 1 percent (matching the bond yield) for planning through age 100. The reason that returns increase with the time horizon is because to sustain spending for longer, the spending amount must decrease, which reduces the impact of sequence-of-returns risk.
This concept is seen more clearly in Exhibit 1.3, which provides the corresponding spending numbers for the returns in the previous exhibit. Returning to the same example, if the retiree seeks a 90 percent chance that spending lasts to age ninety, they would choose from the 10th percentile of spending outcomes. That is $42,633 of annual inflation-adjusted spending. To sustain spending through age ninety-five with the same success rate, spending would need to reduce to $37,194. This is a 3.72 percent withdrawal rate from retirement date assets, and it would be the number that corresponds to the 4 percent rule-of-thumb with these market expectations for a thirty-year retirement. If sustainability with 90 percent success was instead sought for thirty-five years through age 100, then the annual spending number falls further to $33,418. Again, it is because the spending amount decreases that the return assumption can increase; the lower spending rate reduces the exposure to sequence-of-returns risk and reduces the impact of investment volatility in the retirement plan.
Exhibit 1.3 Sustainable Spending for a Sixty-Five-Year-Old with $1 Million of Assets Reverse Engineered Inflation-Adjusted Sustainable Spending Amounts for Retirement
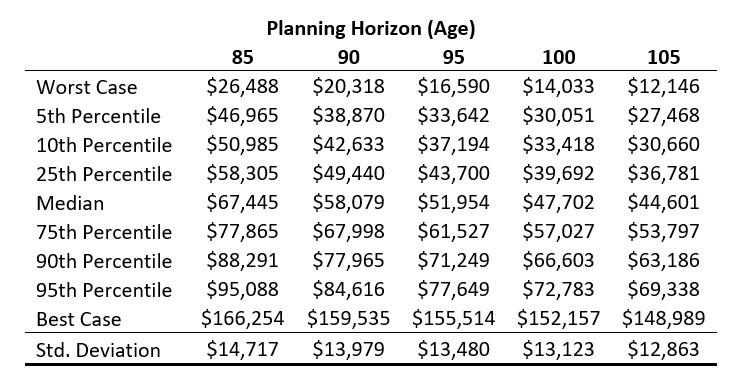
Source: Own calculations with 100,000 Monte Carlo Simulations for a 50/50 portfolio of stocks and bonds. These calculations are based on the net portfolio returns shown in Exhibit 3.11. The portfolio’s real arithmetic return is 4% and standard deviation is 10%.

This is an excerpt from Wade Pfau’s book, Safety-First Retirement Planning: An Integrated Approach for a Worry-Free Retirement. (The Retirement Researcher’s Guide Series), available now on Amazon


