Determining the sustainable spending rate from a diversified investment portfolio in retirement requires making decisions about longevity and market returns. The final section in this chapter provides an opportunity to integrate this discussion in order to obtain a better sense about sustainable distributions from an investment portfolio in retirement.
Rather than blindly applying something like the 4 percent rule-of-thumb for portfolio distributions, we can create a more realistic analysis using the process described in this section. This process provides sustainable portfolio distributions that are calibrated to the retiree’s longevity risk aversion (see callout box) and accepted risk for outliving the investment portfolio.
Looking ahead, we also seek to develop market return assumptions that can be applied to the pricing of annuities, with regard to the bond yield curve, fees, and other related assumptions, so that we are able to compare investments and annuities on an equal footing.
Exhibit 1.1 brings together the factors that determine portfolio return assumptions as outlined in this chapter. To derive generalized stock and bond returns, we start with the components of portfolio returns: inflation, real bond yield, and a risk premium for stocks relative to bonds. First, the inflation assumption is 2 percent, which is based on the current break-even inflation rates between traditional Treasury bond and TIPS as was shown in “The Yield Curve And Break-Even Inflation”.
Next, the assumed real bond yield and return is 1 percent. This is based on the current TIPS yield curve also seen in “The Yield Curve And Break-Even Inflation”. When building a bond ladder for retiree income, the average yield for the ladder matches closely to the long-term TIPS rates, which are approximately 1 percent. Sustainable spending is approximated quite well by assuming a flat yield curve at the long-term interest rate as compared to pricing a bond ladder based on the entire yield curve. As our focus is on comparing the risk premium to risk pooling, we simplify the analysis for bonds by assuming a flat yield curve with a 1 percent real yield. When inflation is included, the yield curve is flat with a 3 percent nominal yield. These two values become the assumed gross arithmetic returns for bonds.
As for stocks, I assume a risk premium of 6 percent. This matches the historical risk premium for the S&P 500 over long-term US government bonds (as our yield curve, again, is based on a long-term bond to reflect the average yield from a retirement income bond ladder) as shown in “The Case for Stocks”. Implicitly, then, stocks are represented by the S&P 500. Adding the historical equity premium to the bond returns, we obtain an assumed 9 percent nominal arithmetic return and a 7 percent real arithmetic return for stocks. Interest rates are lower today, and the financial markets expect inflation to fall below its historical averages, which is why our return assumptions end up lower than their historical values.
The next step in Exhibit 1.1 is to adjust these gross returns to account for all of the various factors we discussed. While the portfolio diversification and alpha factor could increase returns, the other factors listed (fees, investor behavior, taxes, and above average market valuations) would generally lead to lower net returns. For the baseline assumptions to be used for investments in this book, we will give the benefit of the doubt to investments and assume no adjustments for these various factors. This also justifies the assumption of fair annuity pricing at the beginning of the next chapter. As will be seen in later chapters, the case for using risk pooling to support retirement income is quite strong even when we do not reduce net portfolio returns for investments. As such, in Exhibit 1.1 we assume that the net returns for stocks and bonds match their gross returns.
The next steps in Exhibit 1.1 are to decide the standard deviation assumptions for the asset classes as well as the asset allocation for the portfolio, and to then combined these details to create overall net return and volatility assumptions for the portfolio. In this example, I assume a standard deviation of 20 percent for stocks. This closely matches the historical volatility for the S&P 500, which the Summary Statistics for US Financial Market Annual Returns and Inflation, 1926–2018 shows was 19.8 percent for both nominal and real returns.
As for bonds, I assume a 0 percent standard deviation. This simplifies the fixed-income yield curve and inflation to be unchanging over time. It also means that bond yields and bond returns are the same. Since total returns for a bond portfolio are volatile, this assumption requires explanation. I am eliminating interest rate risk from the analysis, as there is no possibility for fluctuating interest rates to create capital gains or losses for the underlying bond portfolio. If interest rates rise, the value of a fixed-income portfolio declines, but the present-value cost of funding a future spending goal also decreases. If the duration of the bond portfolio matches the duration of the spending liability, then interest rate fluctuations have offsetting effects on the asset and liability sides of the retirement balance sheet and interest rate risk is hedged.
Alternatively, we could think of our retiree as holding individual bonds to maturity, which means that any capital gains or losses from interest rate fluctuations would not be realized as the bonds reach maturity and provide their face value as a source of retirement spending for that year.
This simplification about fixed income does not meaningfully impact the decision between investments and insurance; it simply lets us focus more directly on the equity risk premium and insurance risk pooling without also having to further worry about fluctuating interest rates. Bond holdings may be riskier for households not using asset-liability matching than implied by our analysis, which would disadvantage an investment strategy using bonds relative to an annuity. Insurance companies do use asset-liability matching so as to not be forced to sell assets at a loss.
Exhibit 1.1 The Building Blocks of Portfolio Returns
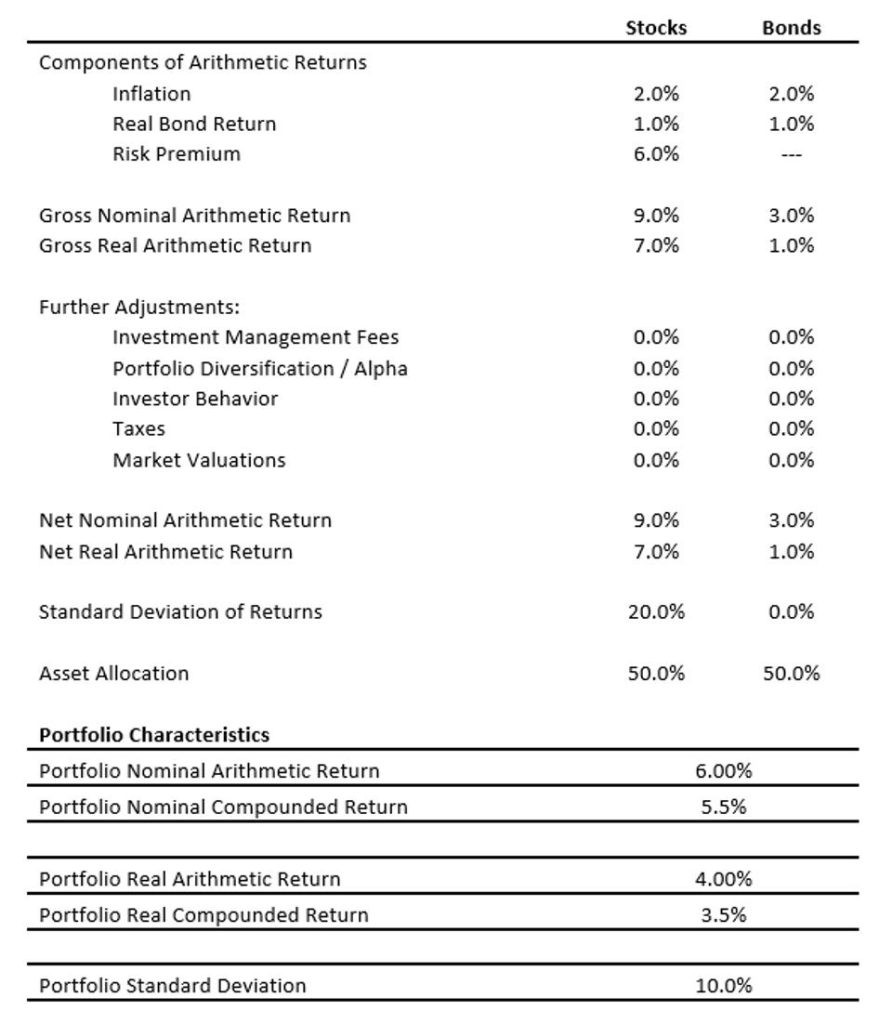
Source: Own calculations and assumptions as described in the text.
To find out more about investing in retirement, read our eBook 8 Tips to Becoming a Retirement Income Investor.
This is an excerpt from Wade Pfau’s book, Safety-First Retirement Planning: An Integrated Approach for a Worry-Free Retirement. (The Retirement Researcher’s Guide Series), available now on Amazon.


