The case for using an aggressive investment portfolio with a high stock allocation to fund retirement expenses rests on the idea that it will probably work. Stocks are expected to outperform bonds, and if and when that happens, a retiree will be able to spend more from their asset base in retirement.
For example, in a February 2016 New York Times column on retiring, David Levine suggested that people treat an all-stock allocation very seriously, saying, “And, so, what I actually say to people who ask my advice is this: Put as much money into the stock market as you can stand. One hundred percent is best, but even if you are very risk-averse, allocate at least 75 percent to stocks.”
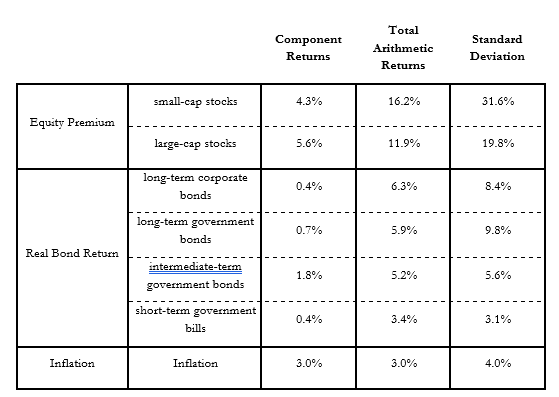
Exhibit 2.1 shows similar details as a previous example (Exhibit 1.1 Summary Statistics for US Financial Market Annual Returns and Inflation, 1926–2018) about returns and volatilities for historical US data. But it also highlights more about the differences in returns as one moves up the exhibit to better highlight the idea of a risk premium. These are the historical excess returns that more volatile asset classes provided. Starting from the bottom, historical inflation averaged 3 percent. Short-term Treasury bills provided a historical average return of 3.4 percent, which is 0.4 percent higher than inflation. That represents the short-term real rate of return.
By investing in intermediate-term government bonds, historically one could earn an average 5.2 percent return, which is 1.8 percent more than Treasury bills and 2.2 percent more than inflation. Long-term US government bonds offered another 0.7 percent higher historical return, and long-term corporate bonds offered an additional 0.4 percent on top of the government bonds for a 6.3 percent total return. Moving into stocks, large-capitalization stocks averaged 11.9 percent returns. This was 5.6 percent more than long-term corporate bonds, 6 percent more than long-term Treasury bonds, and 6.7 percent more than intermediate-term treasuries. These are the types of numbers that are often identified as the risk premium, or the expected additional return of stocks over bonds, at least as based on the historical data. As expected, that risk premium is even higher with small-capitalization stocks, which averaged an additional 4.3 percent more than large-capitalization stocks, or, for instance, 11 percent more than intermediate-term government bonds. These risk premia have been identified in terms of their arithmetic averages.
It is also the case that the compounded equity premium would be less than its arithmetic value. For instance, though not shown in the exhibit, large-capitalization stocks outperformed long-term government bonds by 4.5 percent in terms of compounded growth, as compared to the 6 percent difference in arithmetic terms.
Exhibit 2.1 The Components of US Financial Market Annual Returns, Stocks, Bonds, Bills, and Inflation Data, 1926–2018
Source: Own calculations from SBBI Yearbook data provided by Morningstar and Ibbotson Associates.
These types of comparisons can be made between any of the asset classes in the exhibit, and what these comparisons make clear is that over the entire historical period, stocks have outperformed bonds by a dramatic degree. Those seeking to grow assets in retirement by investing in stocks are relying on these historical relationships to continue in the future.
Advocates for using aggressive investment portfolios as the primary way to fund a retirement plan often will allude to the concept of “stocks for the long run.” There is a degree of comfort that an aggressive portfolio will provide sufficient returns in time to maintain retirement sustainability. According to advocates, the long-run growth potential for stocks can be expected to materialize so that the aggressive portfolio can support a higher spending level than bonds alone.
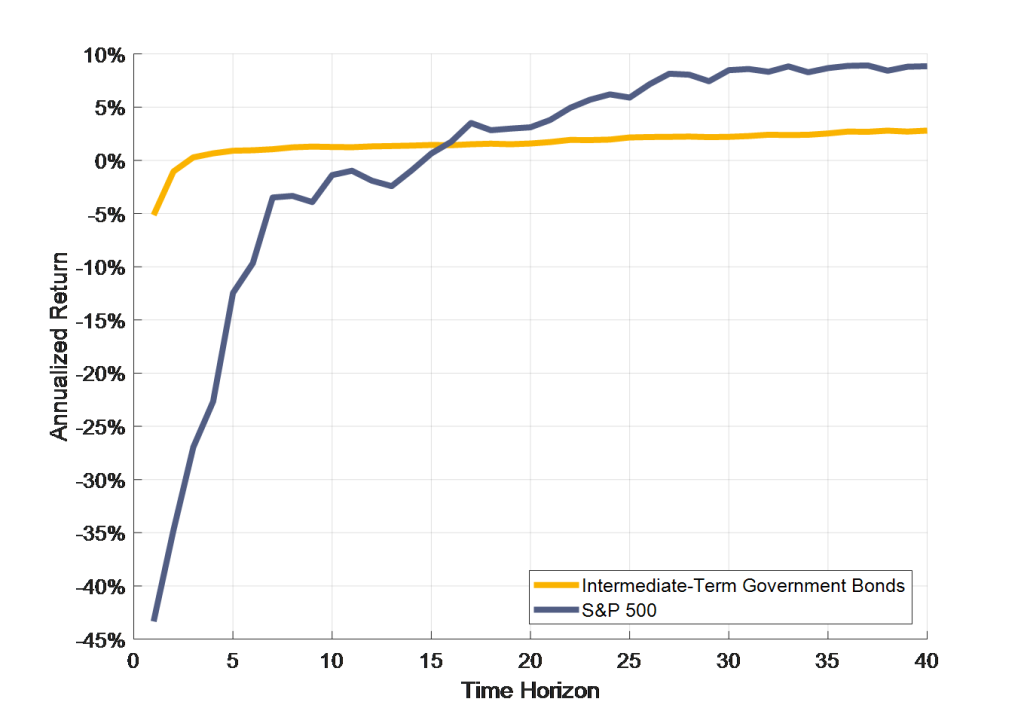
To better understand this probability-based point of view, Exhibit 2.2 plots the historical worst-case annualized nominal returns for large-capitalization US stocks and intermediate-term US government bonds since 1926.
Over shorter holding periods, bonds were less exposed to downside risks. Over one year, for instance, the worst case for bonds was a 5.1 percent drop, while stocks fell by 43.3 percent in their worst year. Over any historical three-year period, bonds provided a positive annualized return. It took fifteen years before stocks historically were always able to provide a positive return. But for holding periods of at least seventeen years, the historical worst-case annualized performance for stocks exceeds that for bonds. Over twenty-year periods, for instance, stocks experienced a worst-case 3.1 percent annualized return, compared to 1.6 percent for bonds. For thirty-year periods, the worst case for stocks was 8.5 percent, compared to 2.2 percent for bonds. And for forty-year periods, stocks’ worst performance was an 8.9 percent annualized return, compared to 2.8 percent as the worst for bonds. For historical forty-year periods, even the best case for bonds (8.1 percent) could not beat the worst case for stocks.
Because probability-based advocates have confidence that the historical record provides precedence for what can be expected in the future, this is the basic logic for understanding the view that stocks should be the primary asset to support retirement expenses.
Exhibit 2.2 Worst-Case Annualized Nominal Returns for Different Holding Periods S&P 500 and Intermediate-Term Government Bonds, 1926–2018
Source: Own calculations from SBBI Yearbook data provided by Morningstar and Ibbotson Associates.
As well, Bill Bengen’s work that led to the 4 percent rule-of-thumb for retirement spending is also a historical exploration which shows that higher stock allocations have tended to support more spending with little in the way of additional downside risk. Though not framed this way, Bill Bengen’s research is a type of efficient frontier analysis that includes a spending constraint seeking to maximize the amount that could be spent in the worst-case thirty-year period from the historical data. He found that the highest worst-case spending level could be found for any stock allocation between 35 and 80 percent, and he argued that retirees should attempt to stick with stock allocations in the higher end of the range because this would support additional upside when not in a worst-case retirement scenario.
For historical data, I have confirmed this point in international data as well, showing in my book How Much Can I Spend in Retirement? that across the twenty countries in the Global Returns dataset, the highest worst-case spending rate occurred with at least 50 percent stocks in eighteen of the twenty countries. Only in Sweden and Switzerland did the peak worst-case spending level occur with a lower stock allocation.
This is an excerpt from Wade Pfau’s book, Safety-First Retirement Planning: An Integrated Approach for a Worry-Free Retirement. (The Retirement Researcher’s Guide Series), available now on Amazon.


