People use a variety of adjectives to describe the market – volatile, disastrous, strong, skyrocketing. Lately, the market has been slowly and steadily rising. You might even describe it as boring. I’m tempted to put an exclamation point at the end of that sentence, because we love it when the market is boring.
In fact, the market is being so boring right now that the financial media doesn’t have much to write about other than how we are all obviously doomed and we’ll soon be pining for the tail end of 2008.
While the markets will inevitably turn around at some point and (by sheer dumb luck) someone will happen to call it correctly, we have no way of knowing when that will happen.
This bull market could keep going for another couple years, or it could all come crashing down tomorrow. We just don’t know. But it sure is nice while it lasts, isn’t it?
It’s important to remember that these good times are the market’s compensation for taking on risk. We aren’t getting these returns because we’re nice people. It’s the market paying us for taking on the uncertainty of investing.
But what the market giveth, it can taketh away. And it can taketh incredibly fast.
Often during times like this, investors give into the temptation to stretch a little bit more – either for a little bit more return, or (more dangerously) because the stable market environment makes them think they can handle more risk than they built their portfolio around. It’s a common investor bias called the “recency effect,” and you can learn more about it here.
This doesn’t have to be an overt decision to sell bonds and buy stocks – you can accomplish the same thing by choosing to delay rebalancing your portfolio. The problem is that when markets turn, a seemingly minor decision can get real ugly real fast, which could result in much bigger problems than you would have had if you had stayed disciplined.
So How Good Has the Market Been Recently?
Back in March, I looked at how good the returns of the “Trump Rally” have been from a historical perspective. Turns out they stack up pretty well.
I compared January and February of 2017 to every two-month period going back to 1926 and found that the two months since Trump had taken office were better than 73 percent of other two-month periods. I also found that the four months since Trump won the election were better than 81 percent of other four-month periods.
In other words, if you picked a random two- or four-month period, you would have a 27 or 19 percent chance, respectively, of picking a period that beat the “Trump Rally.” In other words, nothing out of this world, but nothing to turn your nose up at either.
Since I wrote that article, things have continued getting better. We’re currently riding a streak of eight straight months of the S&P 500 Index going up, and we’re looking pretty good for month nine – as of July 16 (when I’m writing this), the S&P is up about 1.15%.(1)
The last time we had a down month was back in October 2016, and before that, the S&P 500 had a seven-month rising streak. We have to go all the way back to the beginning of last year, January and February 2016, to find the last two consecutive down months.
Both of these streaks are unusual. Since 1926, the S&P 500 has only had streaks of eight or more months thirteen times (seven-month streaks have happened eleven times).
To put it mildly, we’re on a really good run.
But even beyond these pure returns, this market has been preternaturally calm, which might have an even bigger impact on people’s impressions of what the market is doing than the actual returns. Looking at the rolling twenty-day volatility of daily S&P 500 Index returns, we can see just how calm the markets have been.(2)
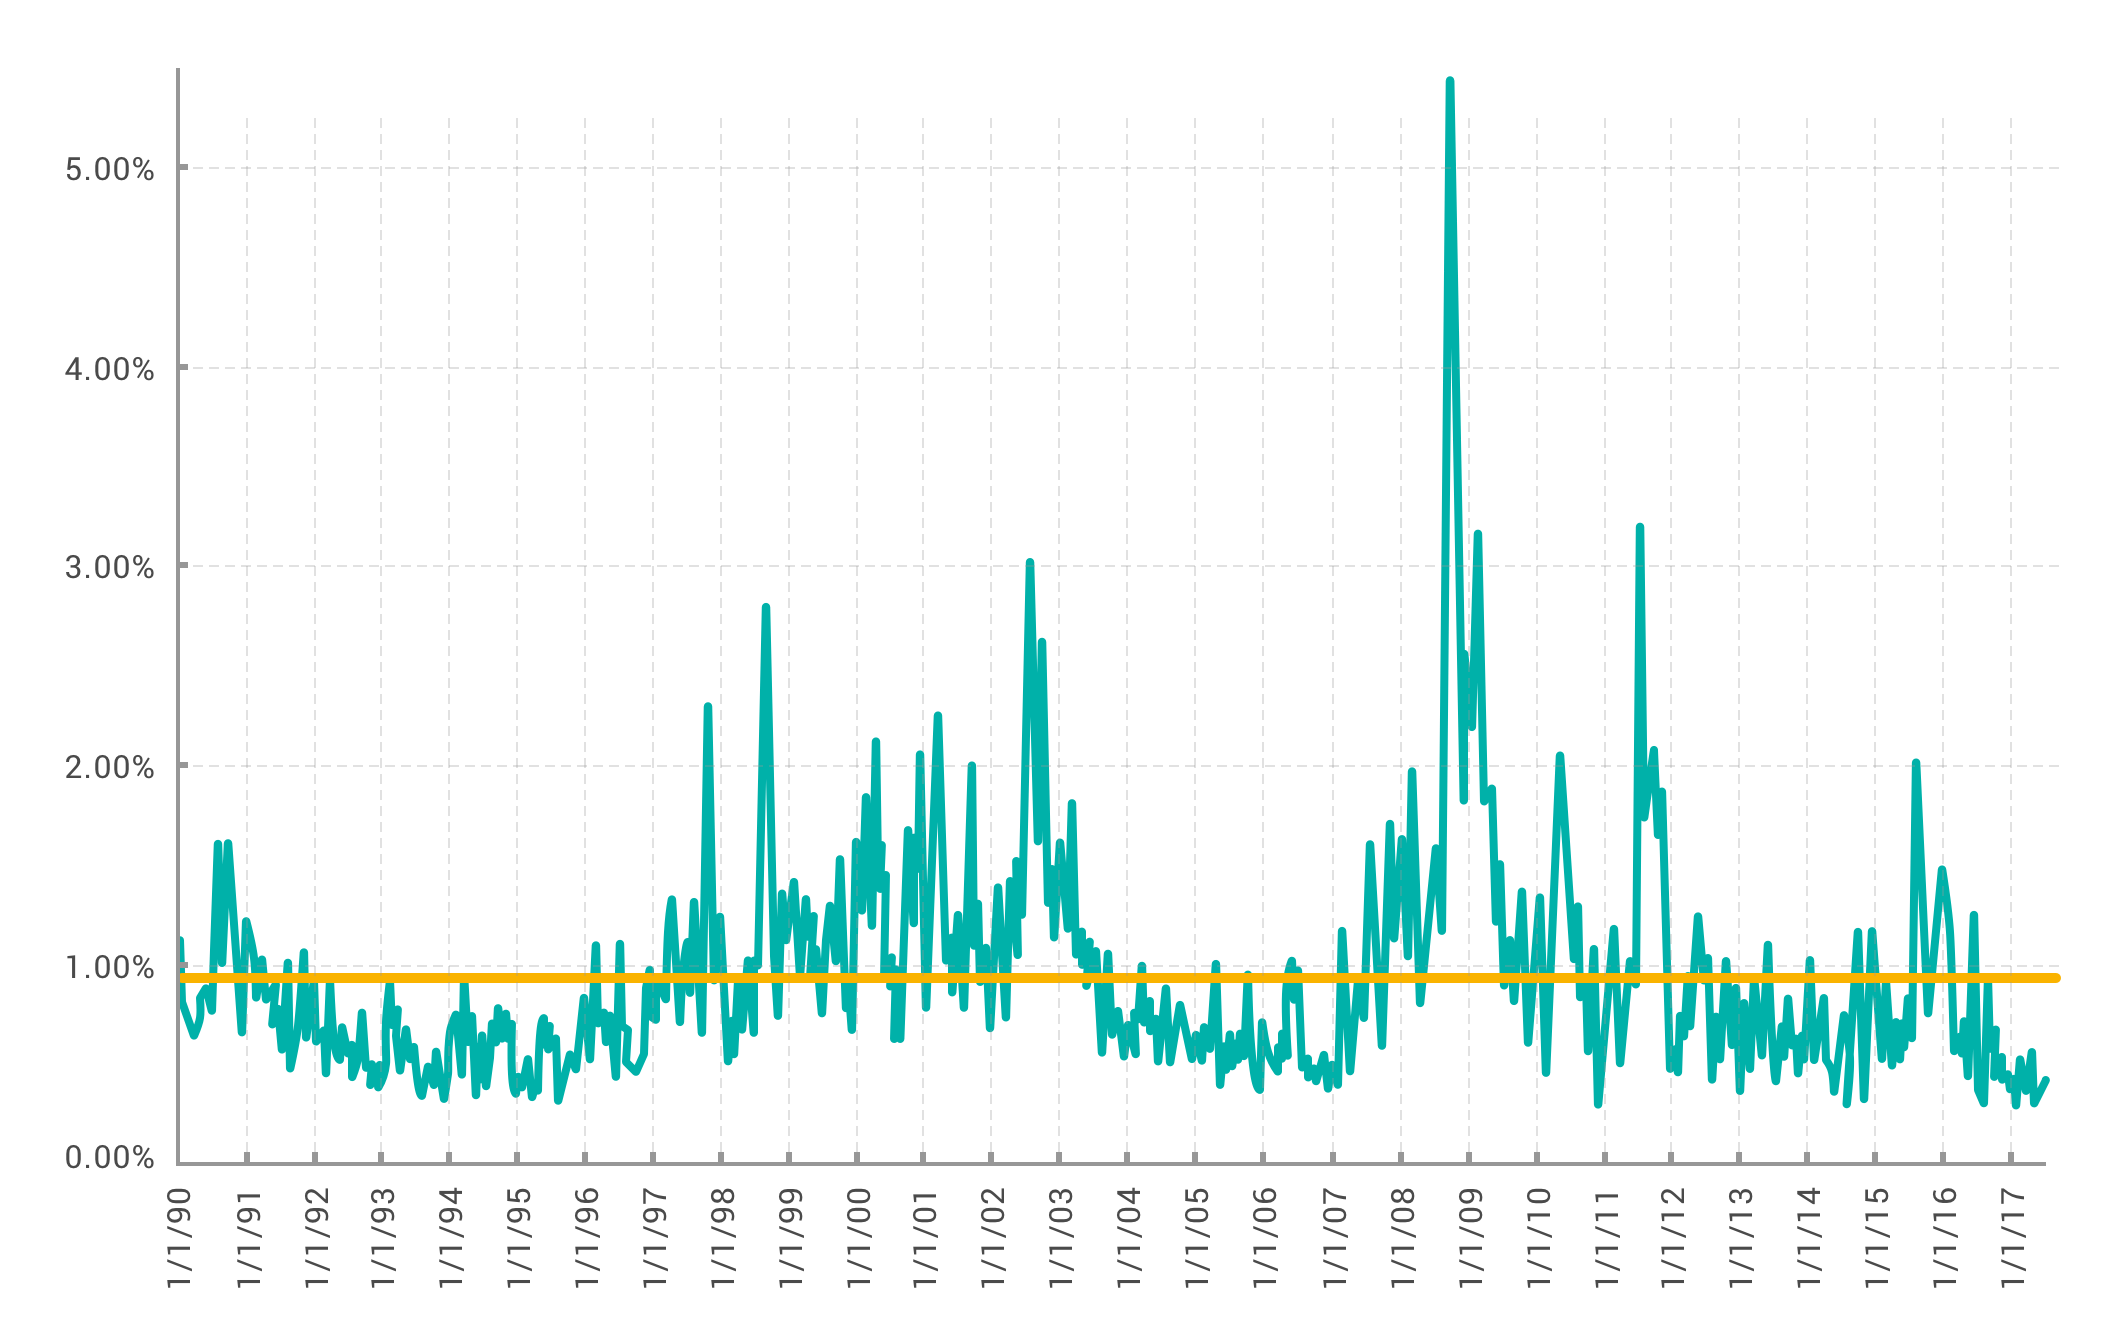
Data from 1/1/1990 – 6/30/17. Indices not available for direct investment. Past performance is no guarantee of future returns. Data courtesy of Yahoo!Finance.
Just eyeballing the chart, you can see that the markets have been pretty calm lately. But take a look at the orange line. That’s the average twenty-day rolling standard deviation of the total period.
We haven’t had a twenty-day period cross that line for a little over a year. The last time it happened was late last June, right around the Brexit vote (in fact, the last period that was above the line was the twenty-day period starting 6/23 – the day of the Brexit vote).
We came really close in early fall 2016. Then this past January, we had a near-deviation experience when everyone thought the Chinese stock market was going to destroy the world.
Again, in other words, things are going pretty great lately.
But that’s the past. It’s already happened. What we care about is what happens next.
Try as we might, we just can’t reliably predict what will happen next. It’s certainly not for lack of trying – pretty much the entire finance industry is devoted to trying to predict the future. Even Gene Fama, the person who formulated the Efficient Market Hypothesis (which says you can’t predict future returns), got into finance by trying to predict stock returns.
You Can’t Predict the Future
Looking at the data, neither the market’s previous returns or its volatility really tell us anything about what the future holds.
One of the easy ways to check if current (or past) returns have any impact on future returns is to use something called autocorrelation.(3) Autocorrelation is a fancy way of saying a series’ correlation with a lagged version of itself.
While it’s not the most sophisticated test, if there is anything there, we should see something in the autocorrelation numbers, and – at least looking at the S&P 500 Index – we just don’t.
| Periods Lagged | Monthly Returns | Quarterly Returns |
| 1 | 0.04 | 0.05 |
| 2 | -0.02 | 0.04 |
| 3 | 0.06 | 0.02 |
| 4 | 0.03 | 0.02 |
Data from 1/1/1990 – 6/30/17. Indices not available for direct investment. Past performance is no guarantee of future returns. Data courtesy of Yahoo!Finance.
If we look at the volatility, we see roughly the same picture. One month doesn’t seem to tell us anything about what the volatility will be in the next month. And that’s pretty apparent when we plot it out.
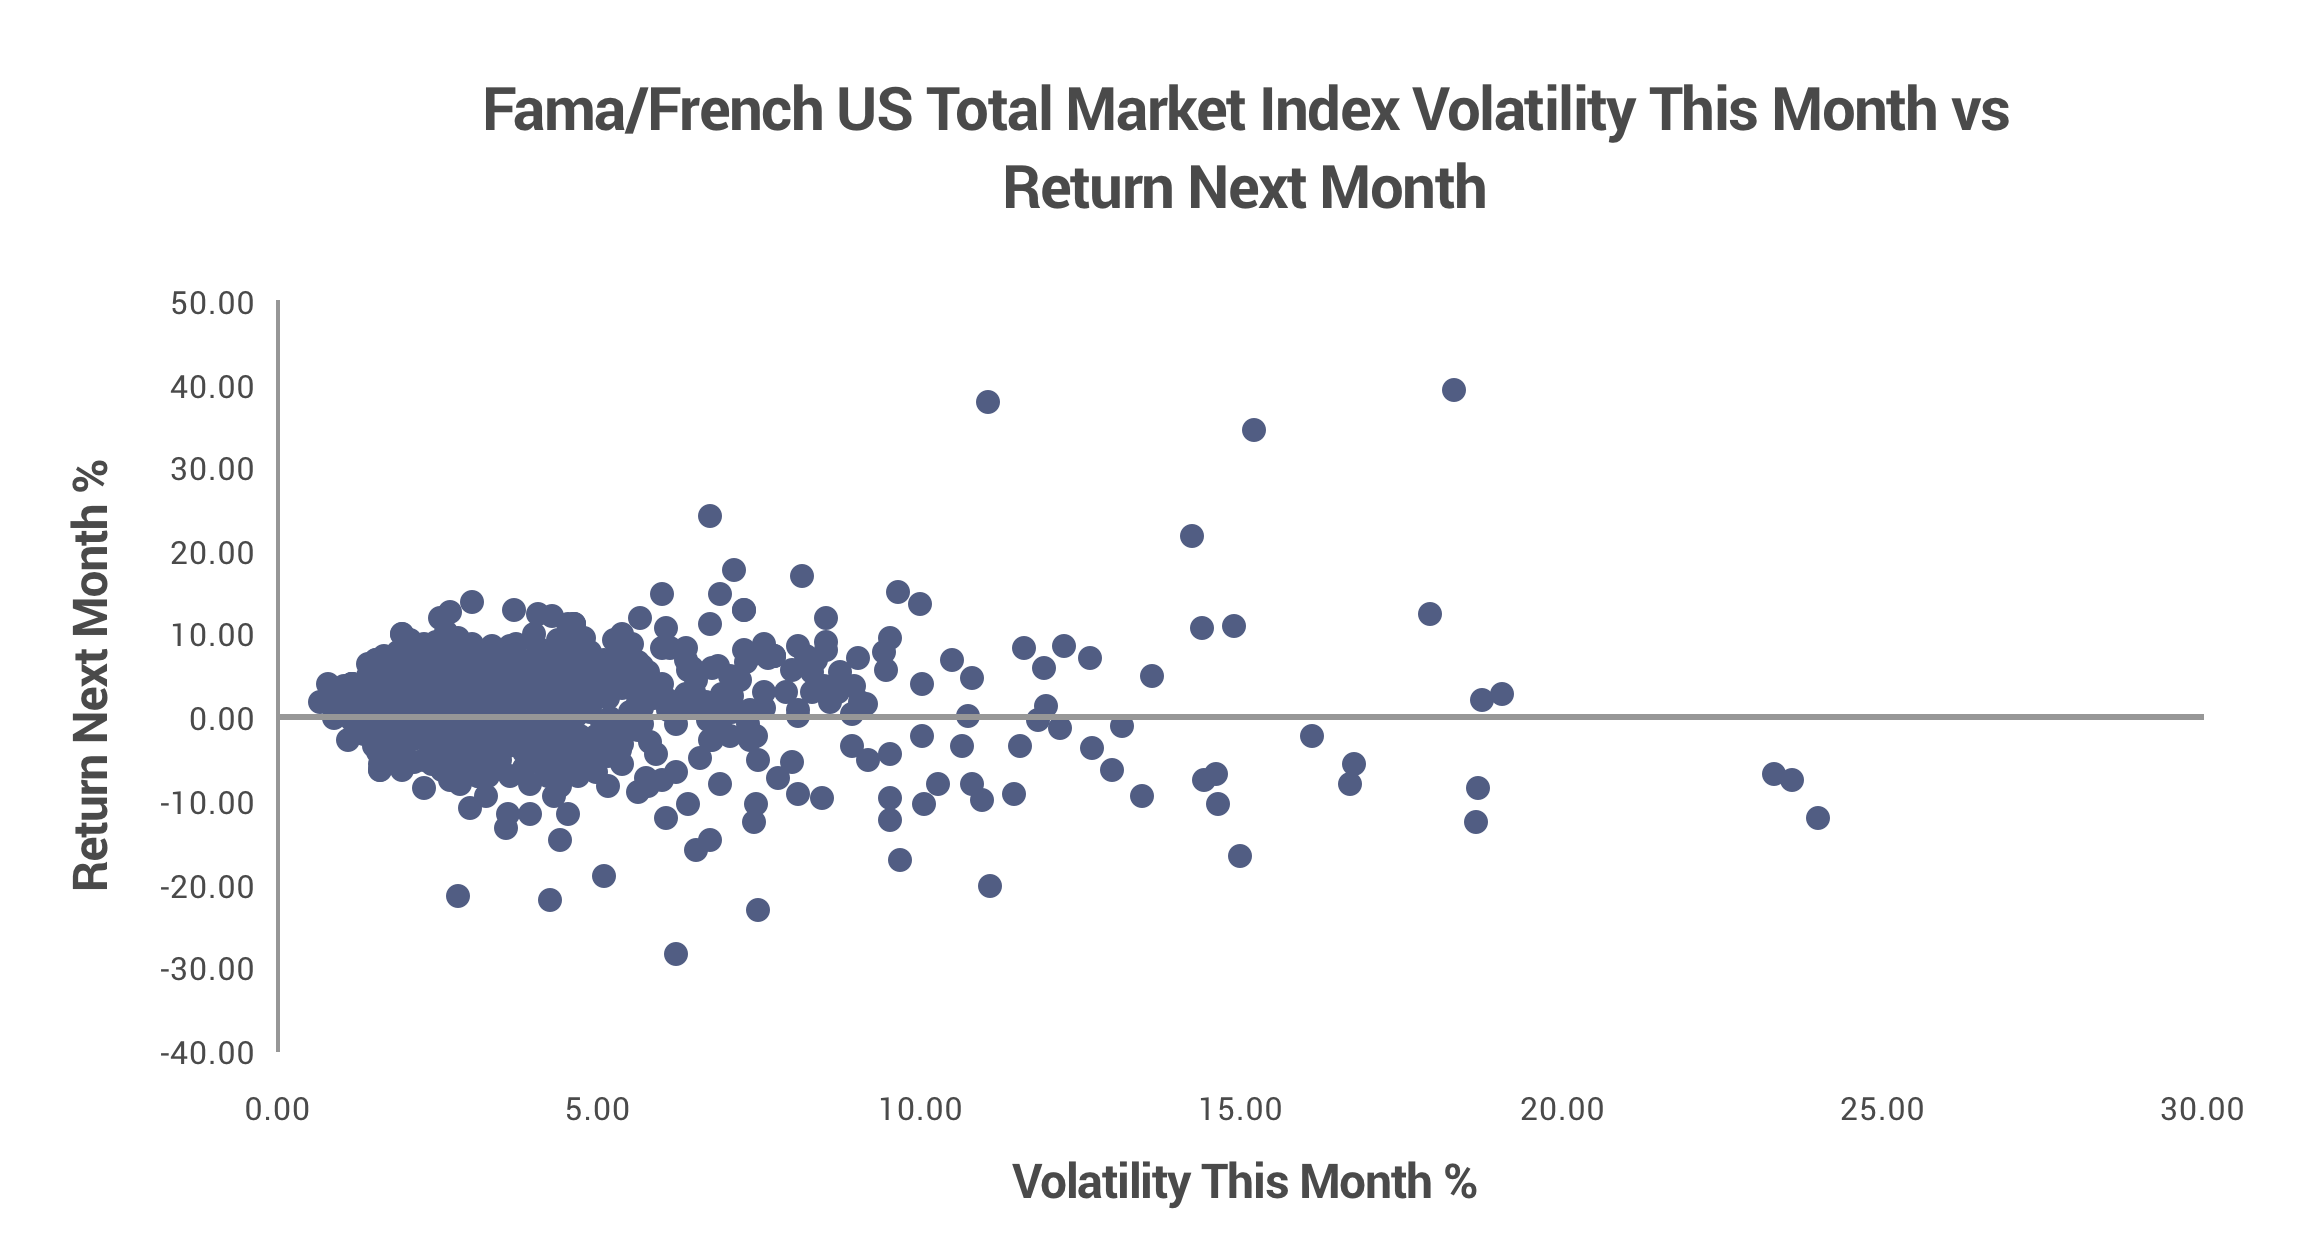
Data from 7/1927 – 3/2016. Indices not available for direct investment. Past performance is no guarantee of future returns. Data courtesy of Dimensional Fund Advisors and Fama/French.
That’s about as flat and random a cloud as they come. The correlation between the volatility this month and next month’s return was only 0.02.
To put all of these correlation numbers in perspective, for the investments course that I am working on I generated two sets of random data, and the correlation of these two sets was all the way up at 0.18. Three times higher than the highest correlation number we’ve looked at here.
If there was an actionable relationship between this month’s returns or volatility and next month’s returns, something would show up in one of these tests. These wouldn’t be the tests to tease out what the relationship would be, but we could tell there was a relationship.
And even more to the point, if there was a way to identify what the markets would do next, we should expect to see some managers consistently beating their benchmarks. We don’t. A manager who beats their benchmark in one period is pretty much just as likely to beat their benchmark in the next period as any other random manager.
As the saying goes: It’s difficult to make predictions, especially about the future.(4)
Good Returns are Dangerous
Often times during long bull markets like this, investors start thinking they can handle more investment risk. They see their friends getting great returns, and everything seems to be sailing along smoothly.
Understandably, they wonder why they should sit in the conservative portfolio they designed back when they were still worried about a repeat of 2008? Maybe they want to get some of those returns while the getting is good. Or maybe they were overcautious because of how bad 2008 was. Either way, it’s really tempting to push on your equity allocation.
And it doesn’t even need to be a conscious choice. Since equity returns have been so good lately, all you need to do is nothing. If you just let things run and don’t bother rebalancing, you’ll end up with the same increased equity exposure you would get if you intentionally redesigned your portfolio.
This is when the greed part of the Fear and Greed cycle tends to kick in.

We get really excited during the good times and want to buy more stocks (which is how prices go up), and when the market turns around – because it will – we’re left with a much riskier portfolio than we can handle.
A lot of people assume they can jump in, catch some above-average gains, and then switch back to their original portfolio before things get too dicey. They may not be so bold as to believe they can call the exact top of the market, but most people believe they can get close enough to capture the gains without taking the losses.
The truth is, no one can predict when to switch back to their original portfolio. There’s simply no evidence that it’s possible. It’s constantly and quickly bouncing around. Trying to time the market is like firing a gun in a small metal room and trying to get out of the way as the bullet ricochets from wall to floor to ceiling and back again. You can’t predict where it’s going, and you can’t move quickly enough to avoid taking a hit.
During the Global Financial Crisis, from the peak of the market to the bottom (10/9/07 – 3/9/09), the S&P 500 index was up more than 49 percent of the time. In fact, there were only six more down days than up days.
The bigger problem isn’t so much the “extra” loss you take during the downturn – though that sure doesn’t help anything. The real risk is that, because you overextended and got burned, you’ll pull too far back the other way. You’ll react and either make your portfolio too conservative, or just get out of the market entirely.
This is bad. Most people need some level of market risk (as part of a broader retirement income plan) to reach their retirement goals. Without the expected return that comes from that investment risk, you may not be able to have the retirement you want.
In the short term, after sharp downturns, markets tend to rebound quickly. If you’re out of the harbor when that ship sails, it won’t come back for you. Sure, you can jump on the next boat, but you’ll never catch up with the one you missed. You won’t get those returns back. They’re gone for good.
When you buy when things are going well and sell when things are going badly, you end up buying high and selling low – the opposite of what investors want to do.
As always, the answer is to be disciplined with your investments. Your portfolio needs to evolve with you as your life changes, but you shouldn’t make changes just because the market seems to be (or is) doing well. That’s just setting yourself up for an expensive lesson from the markets.
Investing should be boring. It may be fun to talk about high returns, but to get those returns you need to take on a lot more risk, which carries the potential of bigger losses – and those are no fun at all.

(1) S&P data from Yahoo!Finance
(2) 20 trading days is the standard rough approximation of a month.
(3) I’m breaking my own rule here – When I worked at Dimensional Fund Advisors I always told other financial advisors that if they ever started talking about autocorrelation with clients, they already lost…
(4) This quote has been attributed to everyone from Yogi Berra, to Mark Twain, to Neils Bohr. Some folks have tried to track down the origin of the quote, but it’s still up in the air.


