The financial media loves to talk about interest rates. There are a lot of good reasons for this, but two of the big ones are that interest rates are really important, and they’re relatively understandable and have a direct connection to most people’s lives. They are tied to the mortgage rate you can get, the rate you get on your savings account, and pretty much everything else that we do with money.
And throughout 2022 we’ve seen interest rates come up significantly. For over a decade – essentially since the Global Financial Crisis in 2008 – we’ve had historically low interest rates. But as we’ve come out of the pandemic these rates have shot up. This has had a lot of implications for the economy – both good and bad – but it’s important to remember that the economy is not the same thing as the stock market. They will roughly rhyme over the long term (and long term here means decades) but they can be wildly different over the short run. When we look at the economy, we’re looking at what has actually happened, or at best what is happening now. The stock market is about the future. It’s about what we collectively think will happen through time. Here I want to focus on the stock market.
Before we dive into the analysis, there are two things that I want to do. First, I want to talk about what interest rates are. This is one of those finance terms that gets thrown around a lot, but never really gets explained in context. So, let’s do that. And the second thing that I want to do is put our current interest rates into context.
What are Interest Rates?
For our conversation today, they’re the yields on Treasury Bonds. The term can be used more narrowly, such as talking about what the Federal Reserve is doing with the Federal Funds Rate (more on this later), or more broadly, such as when people talk about the interest rate environment for all bonds.
But a good way to think about it is to go back to basics. A bond is just a loan. When a company issues a bond, they are taking out a loan from whoever buys that bond. Typically, bonds are set up so that they pay a semi-annual coupon, and then pay off the principal at the end of the bond’s life. It’s pretty much just a really fancy interest only loan. Interest rates are just how much it costs to borrow money – same as when we talk about the interest rate on a mortgage.
We’re going to focus on US Treasury bonds for two (interrelated) reasons. The first is that US Treasury bonds are ubiquitous. They are nearly impossible to avoid if you see any sort of financial news. So, they’re a pretty good place to start. The second reason (and the reason they are so ubiquitous) is that they are generally considered the safest bonds out there. This means that we can largely discount the risk that we won’t get our money back. We can get at something like a baseline interest rate.
Where do current interest rates stand historically?
It’s important to put things into context. If you just listen to the financial media, it’s pretty easy to assume that we’re seeing completely unprecedented interest rates. That’s just not true. For this analysis we’ll keep it simple and largely focus on the One Year US Treasury Bill rate. With bonds there are two risk factors: Term and Credit risk. Just like focusing on US Treasury bonds lets us avoid most of the effects of credit risk, focusing on a relatively short-term interest rate (like the One Year US Treasury Bill) allows us to avoid most of the effects of term risk.
As of the end of March 2023, the One Year interest rate was 4.64%. To put this into perspective, this puts us in the 46th percentile of interest rates from January 1962 to March 2023. In other words, almost exactly in the middle.
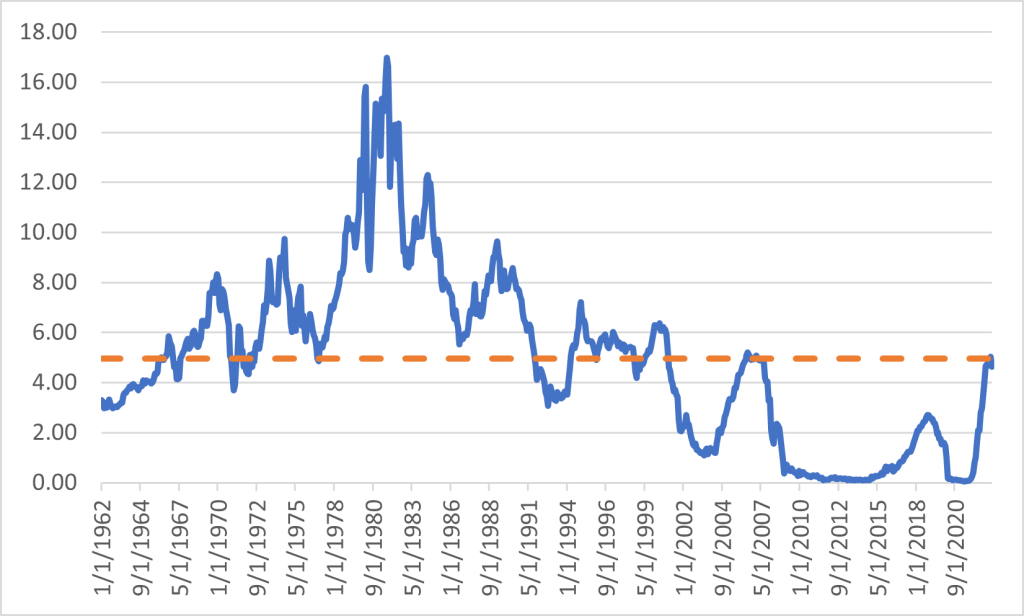
Admittedly, how we got here wasn’t particularly average – the lowest month end One Year interest rate that we saw during this period was 0.05% in April 2021 – but we are emphatically at a “normal” interest rate, despite what we are hearing from the financial media. We are just not in the abnormally low interest rate environment that we have been in.
And that brings us to our primary question. Does that matter to the stock market? How do interest rates affect stock returns? We can break this down more specifically by looking at how both the level and movement of interest rates through time affects stock returns.
Does the Level of Interest Rates matter?
Let’s start by looking to see if the level of interest rates impact stock returns. For the rest of the analysis, we’ll use the S&P 500 Index as our stand in for the stock market. So, knowing nothing else, should we expect the market to act differently today, when the One Year Interest Rate is 4.6% versus two years ago when it was 0.05%?
Before we look at the numbers, what would we expect to happen? Well, all else equal, we should expect the stock market to do better, on average, when interest rates are higher compared to when they are lower. You can think of expected stock returns as being built up by various different components. And one of these components is something called the risk-free rate. This is the interest rate that you can get without taking on any risk (finance professors aren’t very creative with their names). Typically, people just represent this with the return of the One Month US Treasury Bill, though technically there is still a tiny bit of risk there. Generally, the higher that the broader set of interest rates are, the higher that the risk-free rate is. And in turn, the higher the expected return of stocks will be.
So how does this pan out when we look at the data?
Well, let’s start simple. Let’s compare the return of the S&P 500 Index in the months where the One Year Interest Rate was above it’s median (4.96% for the 1/1962 to 3/2023 period we’re looking at) versus the months where it was below the median.
| Average Monthly Return | |
| Total Period | 0.91% |
| Months above Median | 1.05% |
| Months below Median | 0.78% |
High interest rate months significantly outperformed low interest rate months by 0.27% per month. Not to put too fine of a point on it, but this is a really big number. When people are obsessing about hundredths of a percent, this is a full percentage point every four months.
But the story gets more interesting when we focus on the edges. Instead of just looking at whether we are above or below the median, what if we look at stock returns when the One Year Interest Rate is either in the top or bottom quartile (top 25% or bottom 25%)? Well, something strange happens.
| Average Monthly Return | |
| Total Period | 0.91% |
| Top Quartile | 0.57% |
| Bottom Quartile | 0.56% |
| Middle Half | 1.26% |
The returns when the One Year Interest Rate is in the top or bottom quartile are basically the same, but they are blown out of the water by the (not so) boring middle.
Why are we seeing this? Especially given that the numbers were so well behaved when we used the median as the breakpoint earlier?
Let’s think about this in context. Focusing on when the One Year Interest Rate is in the top and bottom quartile means that we’re starting to focus in on the extremes. And when you start thinking about how we got these numbers, it starts making sense.
We’ve just come out of one of these bottom quartile periods – where we had one of the stock market’s strongest long term bull markets ever. And on the other side, you had the 1970s. During the 70s you had high interest rates (including a pretty good slug of the top quartile observations) and notoriously crummy stock returns.
When we look at the extremes of data sets, we always need to be cognizant of the context and how individual sets of events can have big impacts. For instance, in this data set, each quartile represents a little bit more than fifteen and a half years. The markets are incredibly noisy, and it’s not hard to find 15 year periods that are just strange. So, it’s important to understand how we get to the numbers we’re seeing – and think about what they are telling us.
Now, this emphatically does not mean that we should ignore those “misbehaving” periods, however much it would make everything easier. They happened. They are in the data. And they could happen again. I remember prior to 2008 hearing people talking about how market returns from the around the Great Depression could be discounted, or even just ignored, because something like that could obviously never happen again. And thankfully we haven’t seen anything like the Great Depression again, but those people aren’t suggesting leaving the late 20s and early 30s out of our analyses anymore.
Overall, we can (moderately) safely say that the markets don’t “like” extremes. They like the boring, mushy, middle, because there is just more uncertainty and risk out on the extremes. And we are emphatically in the middle when we focus on the level of interest rates.
One other thing that is worth calling out – in the past we have looked at how the stock market reacts to the Federal Funds Rate, which is the interest rate that the Federal Reserve will use to make overnight loans to a small group of very credit worthy banks. And we didn’t see much of a relationship between the Effective Federal Funds Rate level and stock returns. The difference is that the Effective Federal Funds Rate isn’t quite the same thing as the interest rates that play into stock expected returns (though they are somewhat related – just not in this way.)
Do Interest Rate Moves Matter?
We talk a lot about how the markets move based on new information. So, let’s use that and look at how the markets respond to new information in the form of interest rate movements.
Just like before, let’s think about what we expect to happen.
A good place to start is to ask why interest rates move. At root, we’re looking at how much it costs to borrow money, and why that price changes. This is a massively complicated question, but one that resolves very nicely into a small set of numbers – bond prices. That said, if we focus on relatively short periods, like one year, and very low credit risk bonds, like US Treasury bonds, there are basically two things at work, and they are often in competition with each other.
The first effect is how likely people think the US government is to default on it’s bonds. Basically, everyone thinks that the US government is going to pay off it’s bonds – especially in the short term (we’ll just whistle past the graveyard on the question of the debt ceiling) – so we’re looking at the changes in just how certain most investors are about these payments. As they get more certain they’ll get paid back, they’ll charge the US government less to borrow money. If investors are less confident in the US government, the Treasury will have to pay a higher interest rate to borrow money.
The other effect is basically an investor’s alternative investment opportunities. What else could they be doing with their money? The more attractive other investments are, the less people will want to put their money in Treasuries – driving down the price. The less attractive those other options are, the more that people will want to buy Treasuries – driving up the price. A good example of this was the Global Financial Crisis in 2008. People were scared to hold pretty much everything, so they shoveled as much money as possible at Treasuries so that they didn’t need to hold stocks or riskier bonds. In fact, this phenomenon – called a flight to quality – was so strong that Treasury bonds were one of the few asset classes that was actually up in 2008.
But let’s take this back one more step and think about the Federal Reserve. The Federal Reserve, or the Fed, is one of the few institutions that directly influence interest rates. When you hear about the Fed raising or lowering interest rates, what they are actually doing is changing the Federal Funds Rate. By making changes to the Federal Funds Rate they can influence interest rates across the market, and the overall economy. If the Fed wants to slow things down, they can raise the Federal Funds Rate, which means it will be more expensive to borrow money. If they want to kick start the economy, they can cut the Federal Funds Rate, which means it will be less expensive to borrow money. Generally, the Fed is going to want to slow things down when both the economy and stock market are doing very well (so stock prices have been going up) and they would want to kick start the economy when the economy and the stock market haven’t been doing well (so stock prices have been going down).
And this is pretty much what we see in the data. During months where the interest rates went up (both the One Year Interest Rate and the Effective Federal Fund Rate) the S&P 500 Index soundly outperformed those months where interest rates went down.
| One-Year Interest Rate | Effective Federal Funds Rate | ||
| Total Period | 0.91% | ||
| Months Interest Rates Went Up | 1.20% | 1.04% | |
| Months Interest Rates Went Down | 0.73% | 0.56% |
So What Does This Mean?
It definitely seems like both the level, and how interest rates are moving can tell us something about what the stock market is doing. So, can we use that to help our investments?
In short, no.
Trying to guess where interest rates are going to go is just market timing, and we’ve talked (at length) about why that doesn’t work. The market simply moves too fast for you to trade before prices adjust to a new piece of information. Especially if you are a normal person who isn’t continuously staring at your Bloomberg terminal. By the time something pops up on CNBC or is in the papers it has already been thoroughly digested by the market. And remember, you have to get it right (at least) twice when you try and time the market – once to make your initial trade, and at least once more to get out of that trade. These problems exist whether you are looking at freely traded Treasury bonds or considering how what the Fed might do will impact prices.
But what about focusing on the level of interest rates? Might you consider adjusting your asset allocation based on what interest rates look like? Since we expect stocks to do better in (moderately) high interest rate environments, couldn’t you bump up your stock allocation during those periods, and pull it back down when interest rates fall (or get too high)? Well, we come back to that idea of what your alternatives investments are.
When interest rates are high, we would expect the returns on bonds to be higher alongside those higher expected stock returns. In fact, it would probably be fair to say that we should be even more confident that higher interest rates mean higher bond returns than we are that those higher interest rates mean higher stock returns. Interest rates are effectively just bond returns. Higher interest rates are a tide that lifts all boats (or at least most of them). Knowing where interest rates are can be useful in calibrating the expected returns you use in your financial plan, but unless you are absurdly specific in your planning, it would be difficult to use it to adjust your asset allocation in any meaningful (and productive) way.
On the other hand, higher interest rates mean that locking in reliable income becomes cheaper. The higher interest rates are, the less it costs (all else equal) to buy an annuity or a bond ladder that will provide a given level of income. Just like anything else, the cheaper something is the more you are likely to buy. So as interest rates go up, you might want to consider if it’s worth locking in some more reliable income.
Interest rates are massively impactful for both the economy at large and the stock market. But that doesn’t mean that you can easily use them to beat the market. Like everything else, the market incorporates new information, including (and potentially especially) interest rates phenomenally quickly. Within the scope of your retirement what matters is not finding some way to eke out slightly higher returns. What matters is designing your investment portfolio to fit inside of, and work efficiently with, your holistic retirement income plan that will help you stay disciplined and moving towards the retirement that you want.


